Hazard: Flood
Country: United States
H
[ Hazard ]
UNITED STATES

Event Date

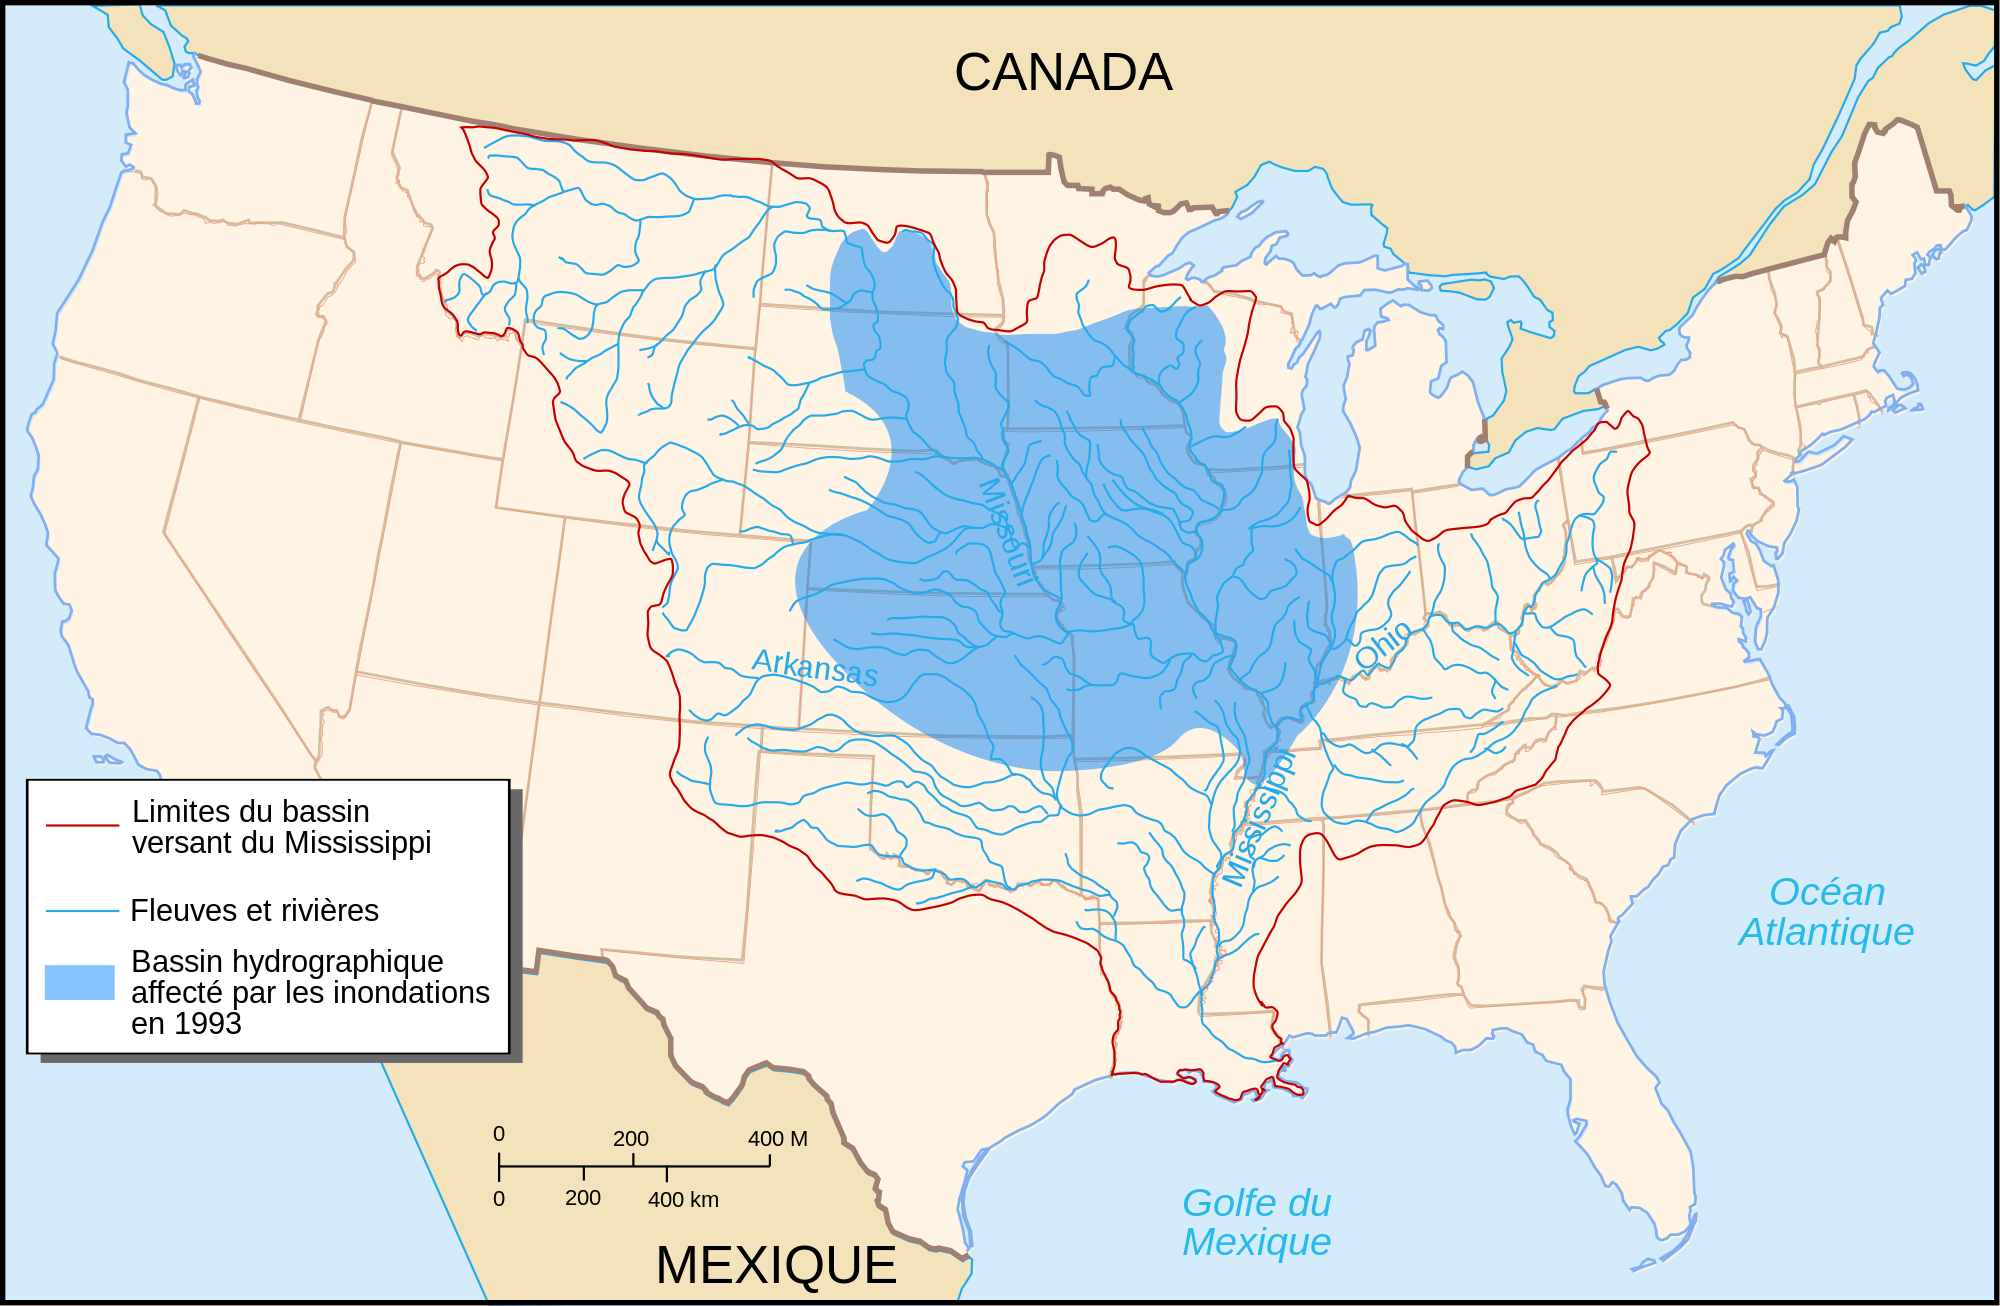
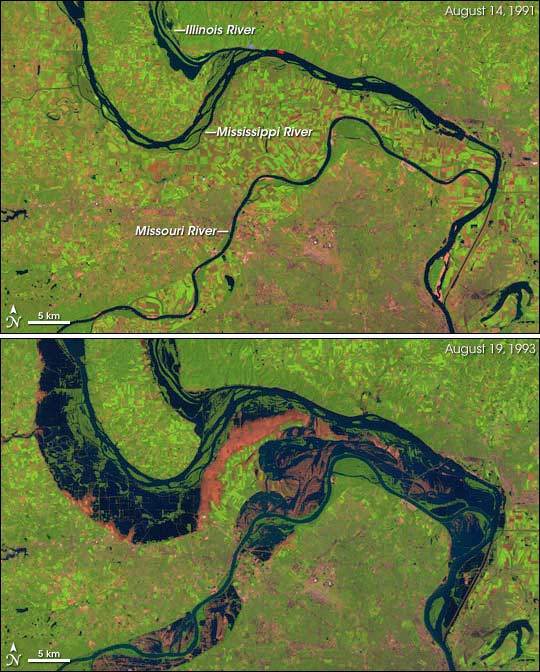
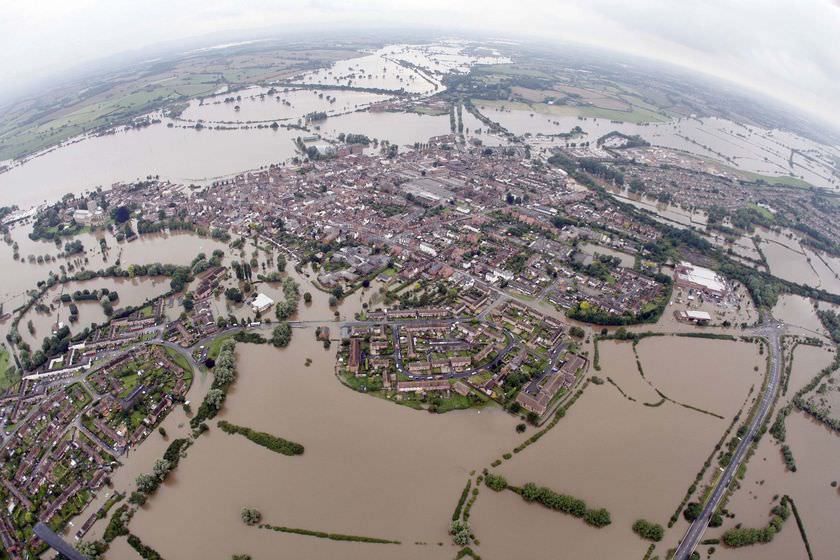
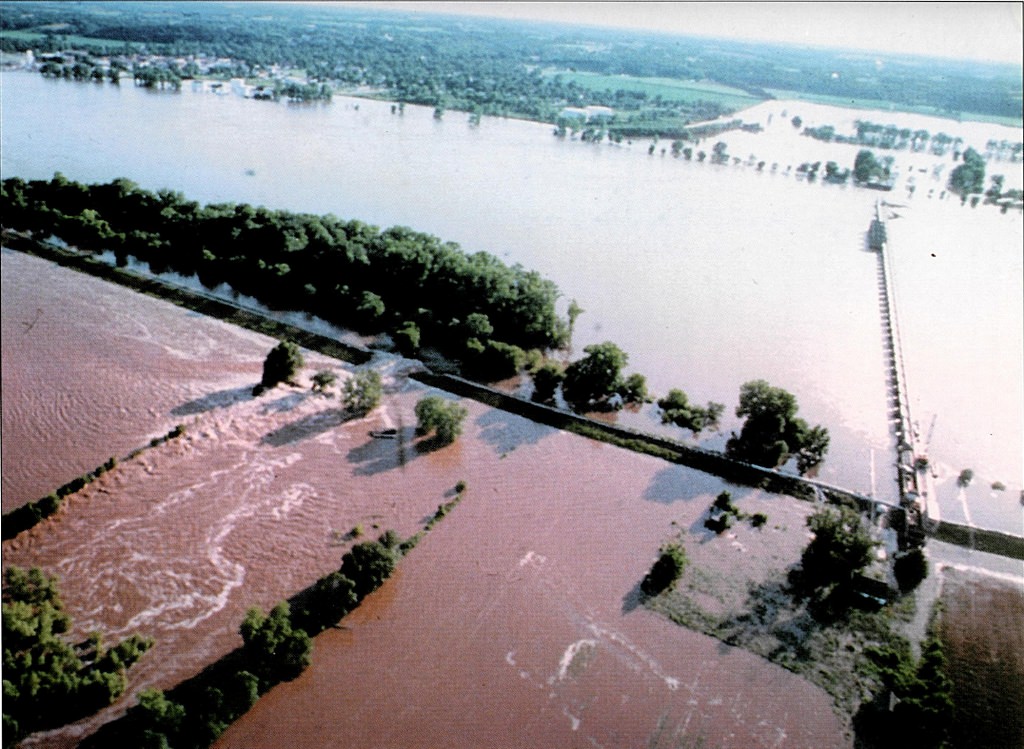
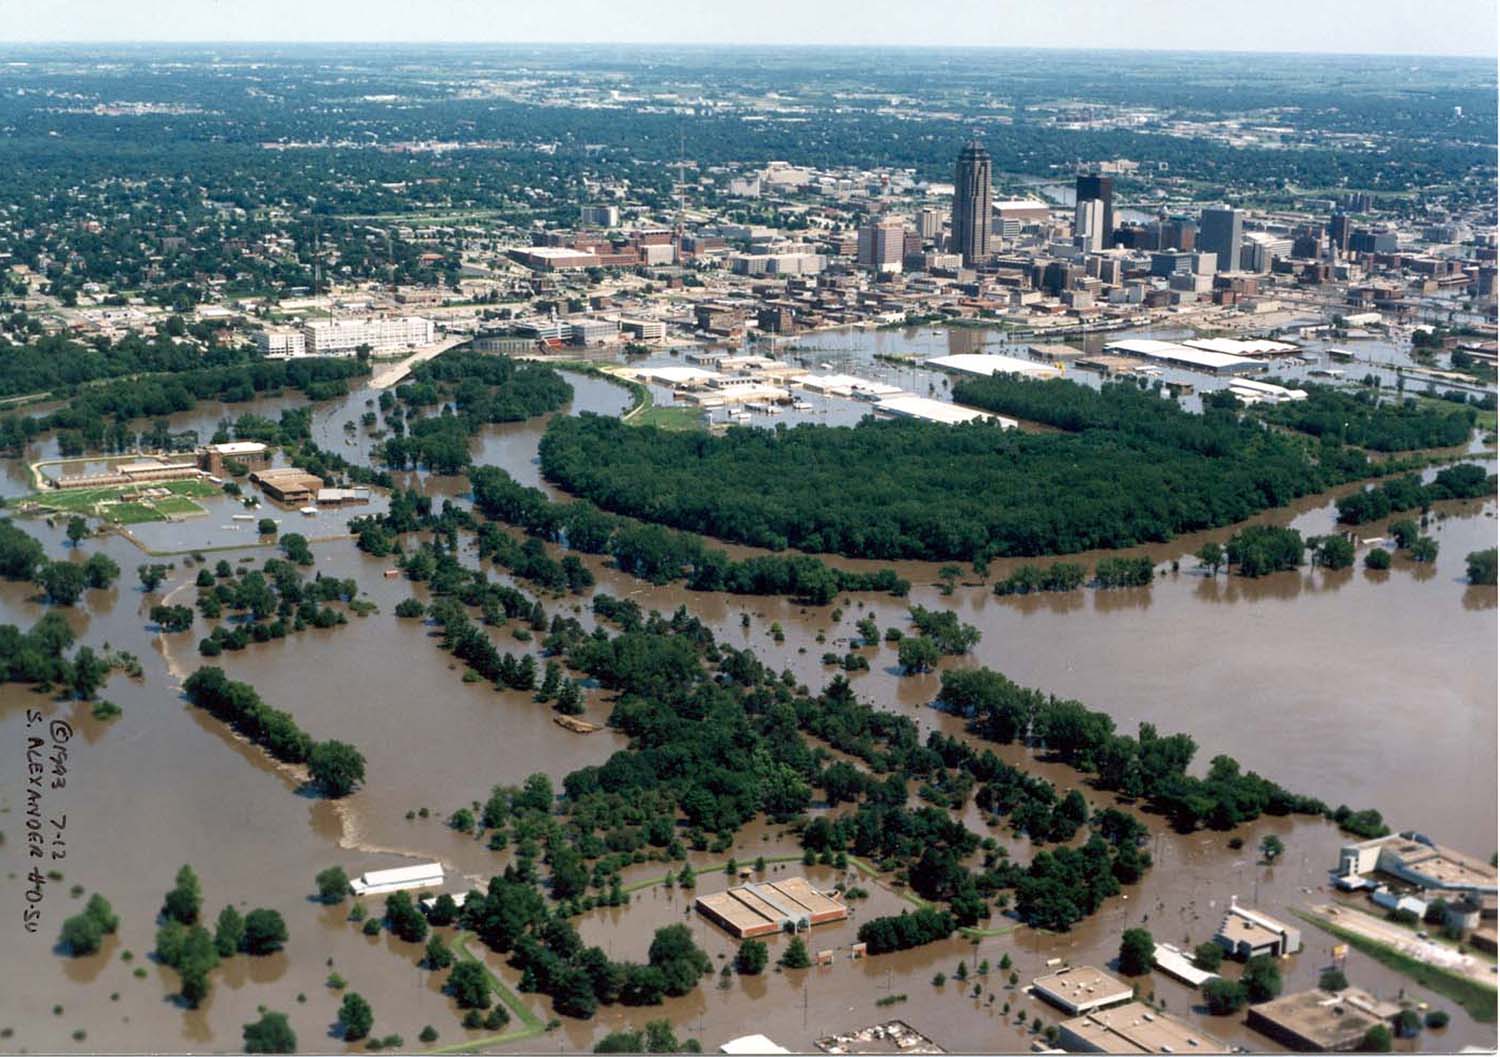
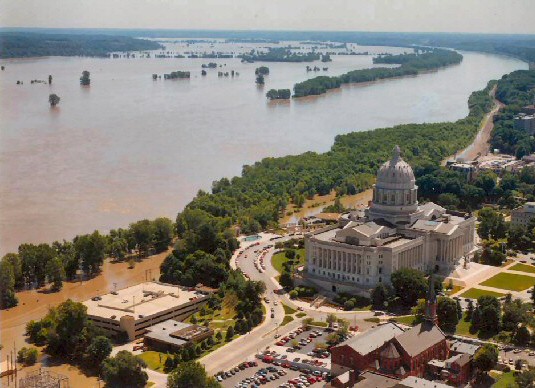
April – October, 1993

Type

River Flood: Mississippi and Missouri Rivers

Notable Features

• Conditions prior to the event:
- Significant rainfall during June and July
- Wet soil conditions in the Upper Midwest prior to the event
• 150 major rivers and tributaries were affected.
• Floods covered an area of 400,000 square miles within 9 states.

Source(s)

• EM-DAT
• NOAA

Videos  Gallery 
Hazard: Flood
Country: Thailand
H
[ Hazard ]
THAILAND

Event Date

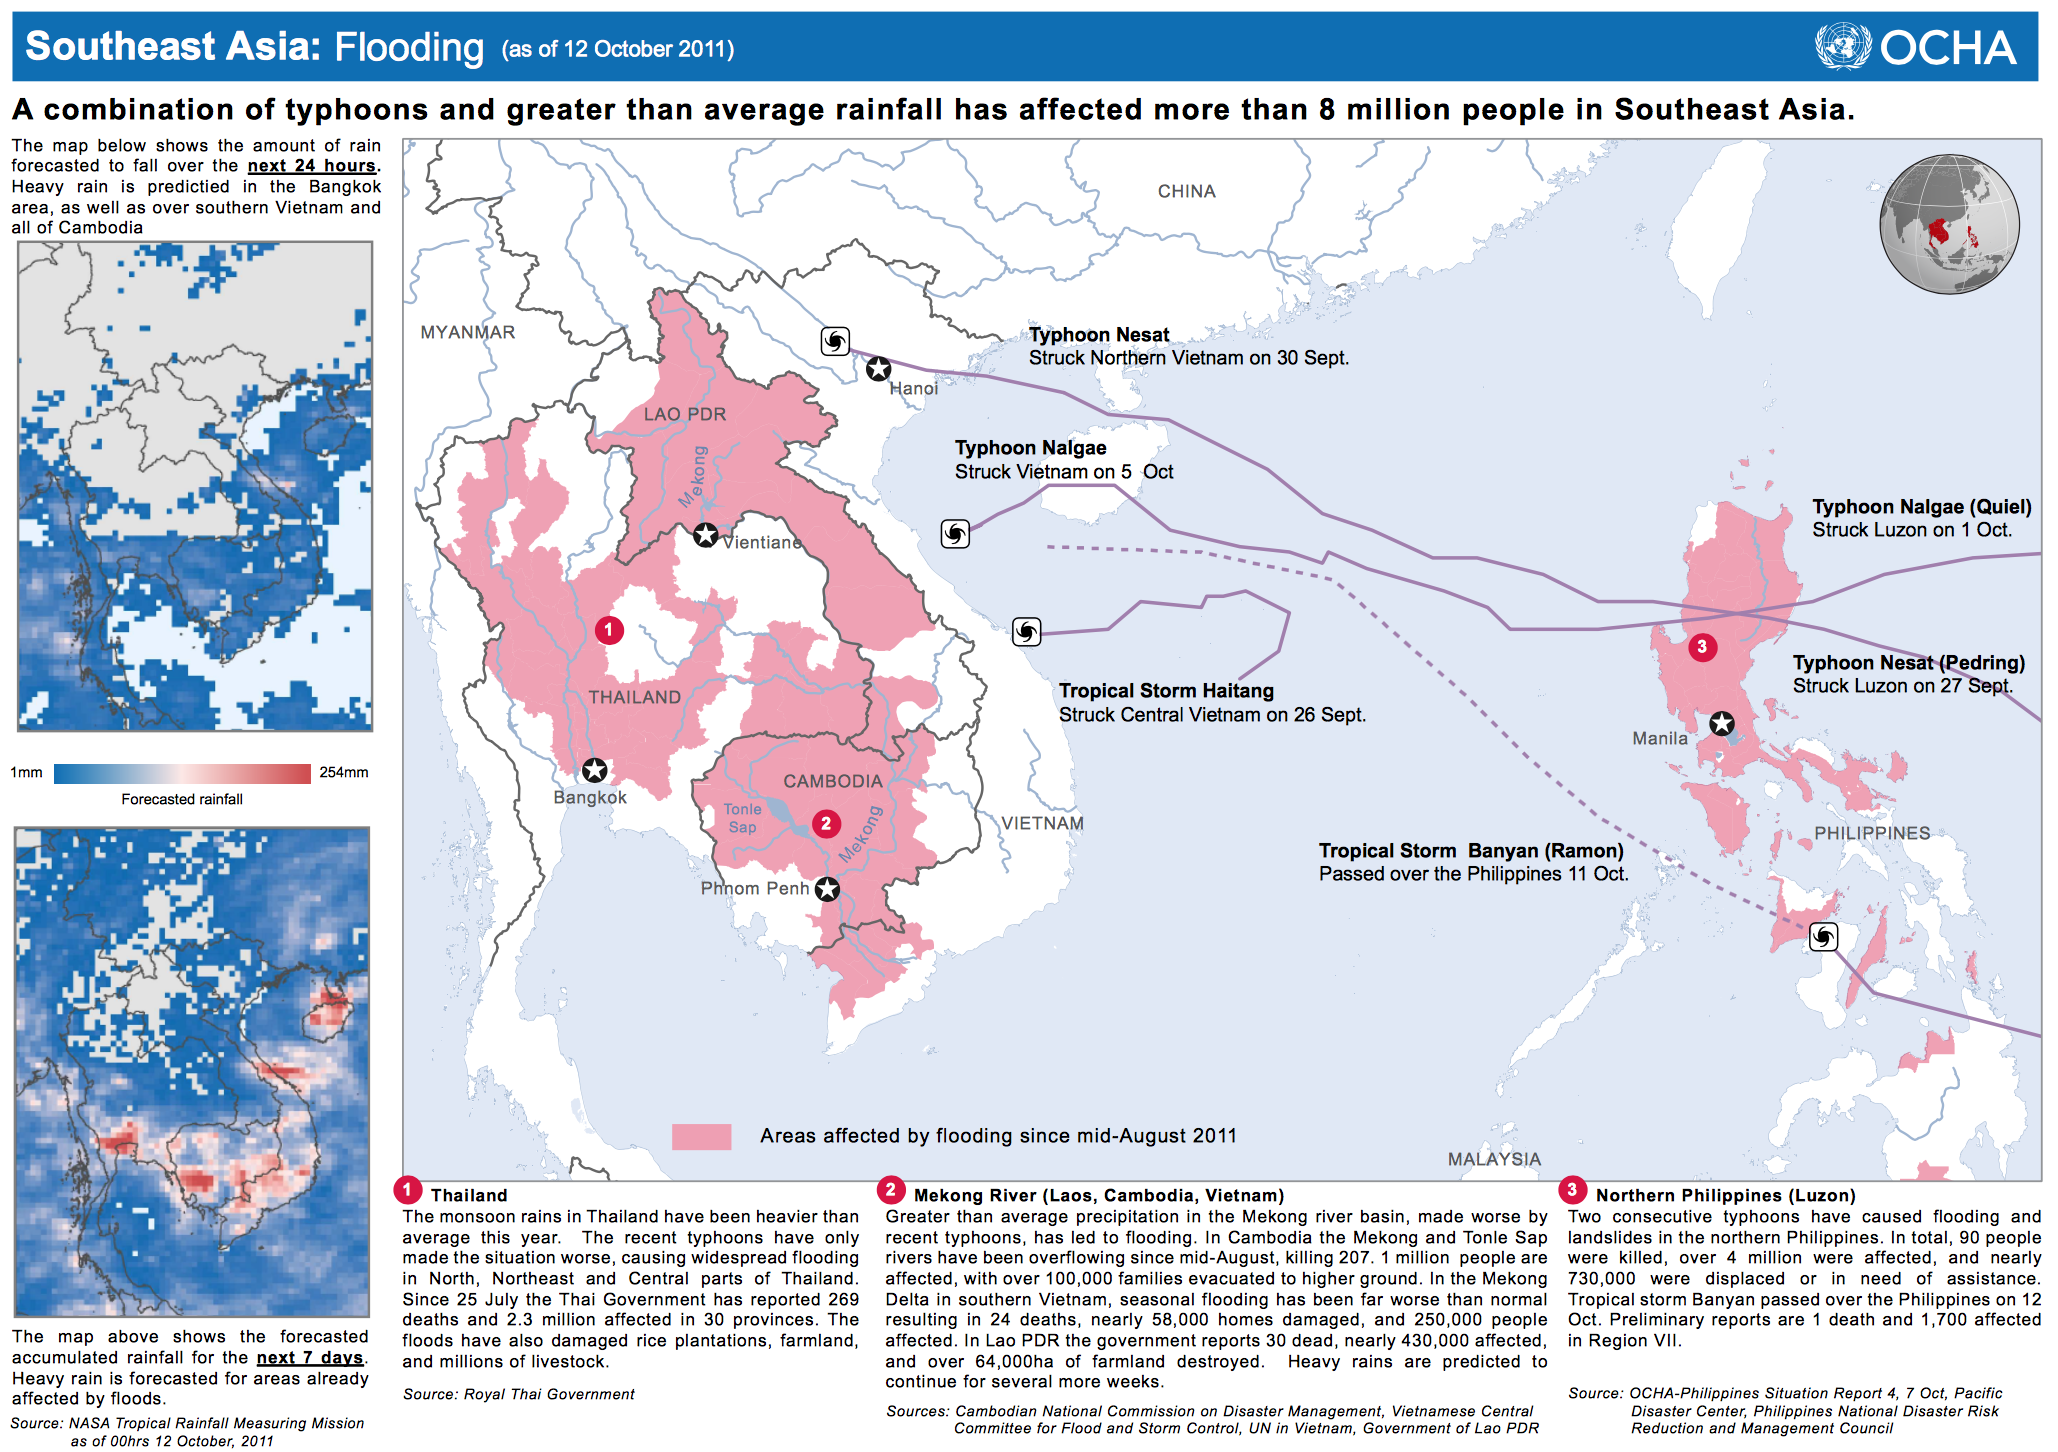
August, 2011 – January, 2012

Type

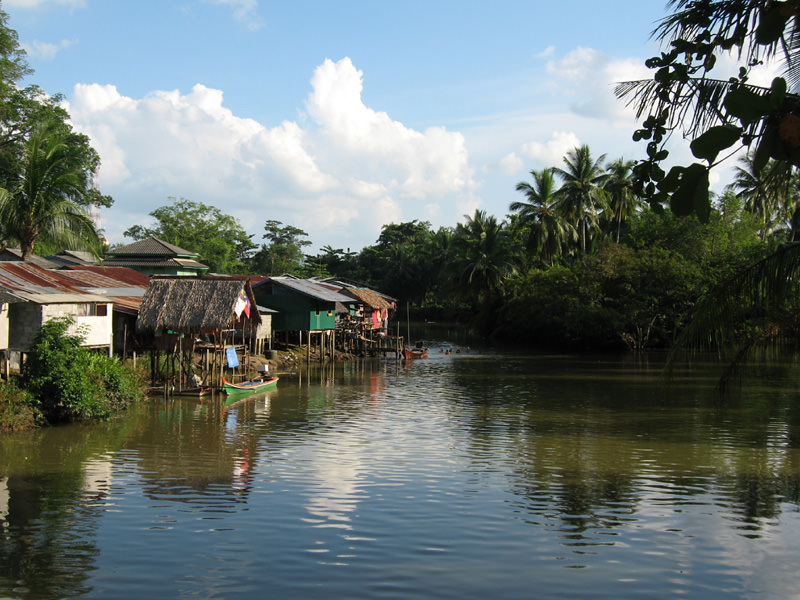
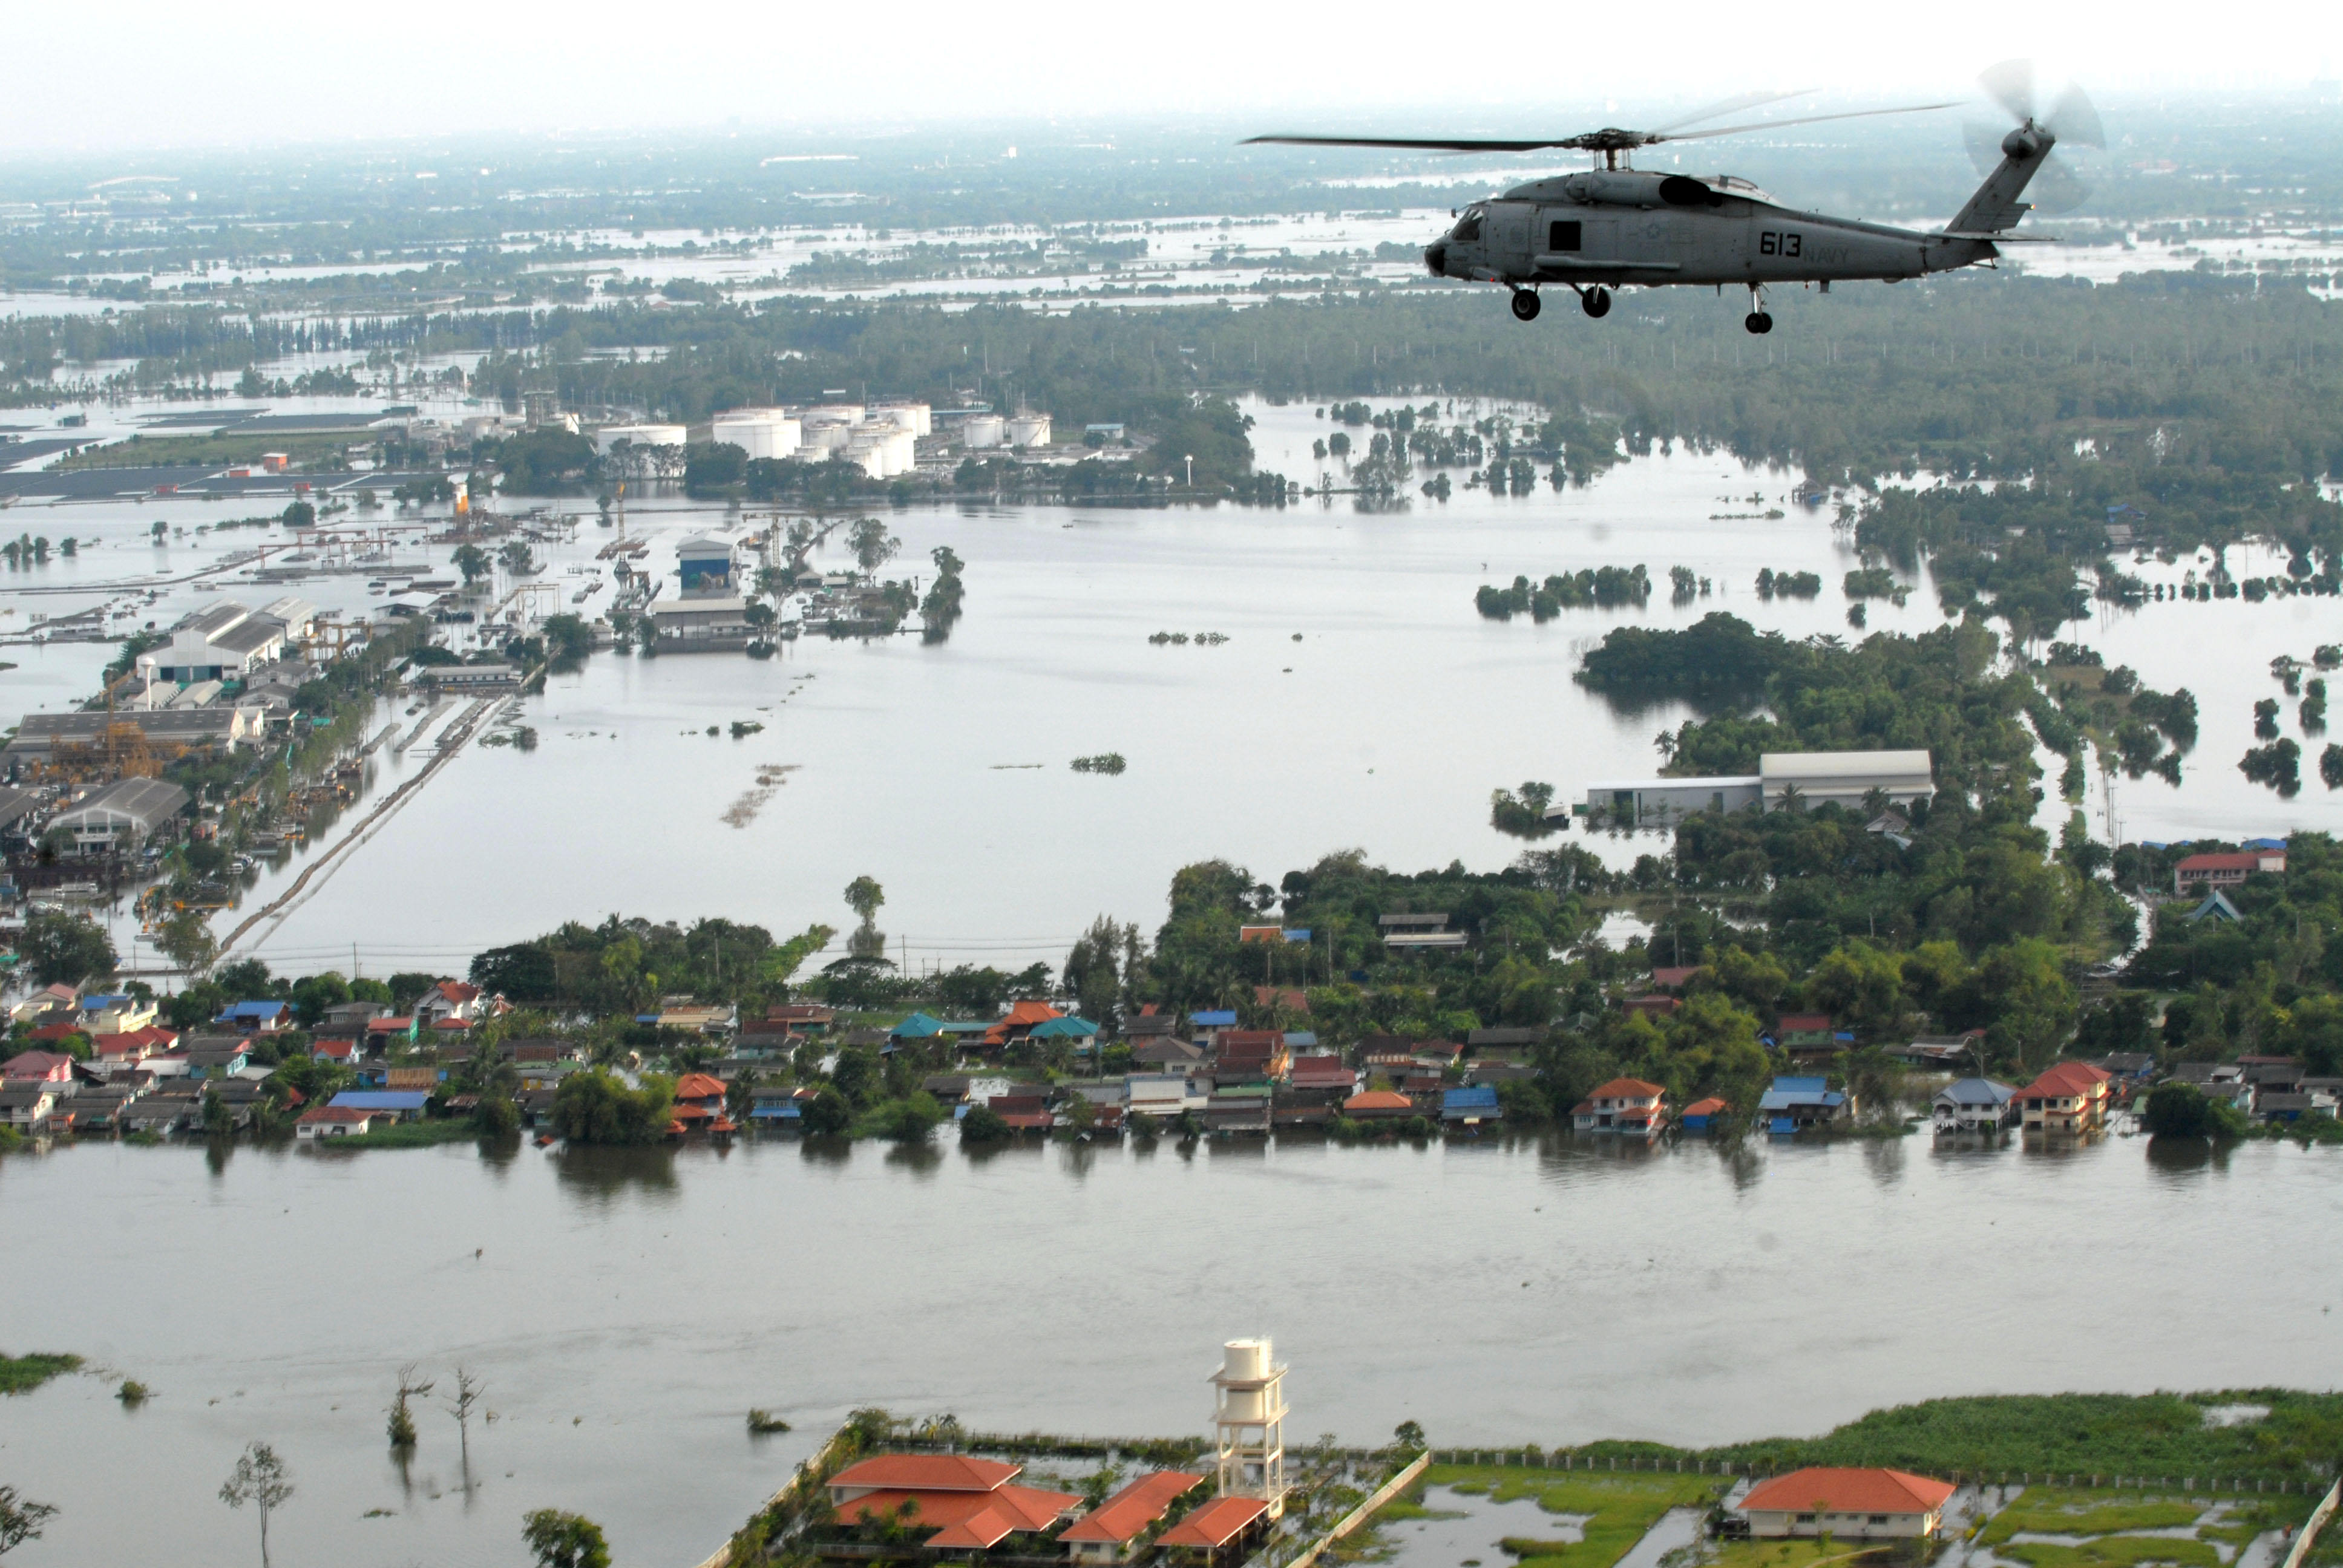
River Flood: Mekong River

Notable Features

• Conditions prior to the event:
- Persisting monsoonal rains
- Active presence of La Niña phase of ENSO
- Remnants of tropical cyclones
• 65 of 77 provinces faced floods.

Source(s)

• EM-DAT
• NOAA
• 2011 Thailand Floods Event Recap Report, AON Benfield

Videos  Gallery 
Ex
[ Exposures ]
UNITED STATES

Principal Area of Impact

Midwest United States

Population Prior to the Event

34.741 Million Estimated (Iowa, Wisconsin, Minnesota, North Dakota, South Dakota, Nebraska, Kansas, Missouri and Illinois States, 1992)

Previous Year’s Gross Domestic Product (GDP)

6.539 Trillion USD (1992)

Previous Year’s Gross Domestic Product Per Capita

25,492.96 USD (1992)

Source(s)

• 1990-2000 State and County Intercensal Estimates, United States Census Bureau
• World Bank Group

Videos  Gallery 
Ex
[ Exposures ]
THAILAND

Principal Area of Impact

Central / Northern Thailand

Population Prior to the Event

57.11 Million Estimated (Bangkok, Central, Northern, Northeastern Regions, 2010)

Previous Year’s Gross Domestic Product (GDP)

318.9 Billion USD (2010)

Previous Year’s Gross Domestic Product Per Capita

4,802.66 USD (2010)

Source(s)

• 2010 Population and Housing Census Executive Summary, National Statistical Office of Thailand
• World Bank Group

Videos  Gallery 
V
[ Vulnerabilities ]
UNITED STATES

Governance

World Bank Group Indicator –
Regulatory Quality (Percentile Rank):

Not Available

World Bank Group Indicator -Government Effectiveness (Percentile Rank):
Not Available

World Bank Group Indicator –
Rule of Law (Percentile Rank):
Not Available

World Bank Group Indicator – Voice and Accountability (Percentile Rank):
Not Available

World Bank Group Indicator – Political Stability and Absence of Violence (Percentile Rank):
Not Available

Corruption

World Bank Group Indicator – Control of Corruption (Percentile Rank):
Not Available

Transparency International Corruption Perception Index Score:
Not Available

Transparency International Corruption Perception Index Rank:
Not Available

Development

World Bank Group - GINI Index:
38.4 (1991)

Previous Year’s Human Development Index Score (HDI):
0.976 (1990)

Previous Year’s Human Development Index Rank (HDI):
7 out of 160 (1990)

Source(s)

• World Bank Group
• Transparency International
• UNDP Human Development Report 1991

Videos  Gallery 
V
[ Vulnerabilities ]
THAILAND

Governance

World Bank Group Indicator –
Regulatory Quality (Percentile Rank):

56.5 (2010)

World Bank Group Indicator -Government Effectiveness (Percentile Rank):
62.2 (2010)

World Bank Group Indicator –
Rule of Law (Percentile Rank):
49.3 (2010)

World Bank Group Indicator – Voice and Accountability (Percentile Rank):
32.2 (2010)

World Bank Group Indicator – Political Stability and Absence of Violence (Percentile Rank):
9.4 (2010)

Corruption

World Bank Group Indicator – Control of Corruption (Percentile Rank):
48.1 (2010)

Transparency International Corruption Perception Index Score:
7.1 (2010)

Transparency International Corruption Perception Index Rank:
22 out of 178 (2010)

Development

World Bank Group - GINI Index:
39.8 (2010)

Previous Year’s Human Development Index Score (HDI):
0.654 (2010)

Previous Year’s Human Development Index Rank (HDI):
92 out of 169 (2010)

Source(s)

• World Bank Group
• Transparency International
• UNDP Human Development Report 2010

Videos  Gallery 
EmR
DR
CatR

[Risk]
UNITED STATES

Total Affected Population

31,000

  • Total Deaths
    48
  • Injured
    Not Available
  • Homeless
    Not Available

Total Damage

$33 Billion (In 2015 USD)

Source(s)

• EM-DAT
• CPI Inflation Calculator

Videos  Gallery 
EmR
DR
CatR

[Risk]
THAILAND

Total Affected Population

9,500,000

  • Total Deaths
    813
  • Injured
    Not Available
  • Homeless
    Not Available

Total Damage

$42 Billion (In 2015 USD)

Source(s)

• EM-DAT
• CPI Inflation Calculator

Videos  Gallery 

Takeaways

Globally, more people are affected by floods than by any other natural hazard event, primarily because human life and access to fresh water are inextricably linked – and have been since the earliest civilizations. While human attempts to “control” flooding (with dams, levees, channeling, etc.) also go back millennia, human and economic exposures from population growth, combined with questionable land use decisions, have greatly increased in the last century, often outstripping vulnerability reduction measures – when such measures have been attempted at all. The 1993 flood in the U.S. Midwest and the 2011 flood in Thailand are unfortunate risk exemplars of exactly that combination of a hazard, increased exposure, and vulnerability.
The U.S. Upper Midwest, 1993. Unusual and unrelenting late spring and summer rainfall drenched the Upper Midwest of the United States in 1993, which led to tributary crests coinciding with crests on both the Mississippi and Missouri rivers, exacerbating the event’s impacts along both major rivers. More than 30,000 square miles in nine U.S. states flooded, killing 48 people and causing more than $20 billion (nearly $33 billion in 2015 dollars) in economic losses. Barge traffic was halted for two months on the major rivers, bridges were out for weeks, fully 10 airports flooded, and highway and rail traffic was severely disrupted throughout the region. Koellner (1996: 68) captured the “in harm’s way” development pattern that had increased exposures by essentially ignoring both history and the natural purpose of rivers:
Large Mississippi River floods previously occurred in 1965, 1969, and 1973 ... [which] floodplain inhabitants typically called … the “greatest flood” in their lifetimes. After each … floodplain inhabitants … wanted better flood protection…. Unfortunately, the floodplains have been developed by private landowners, industries, communities, and states, often for widely varying and conflicting purposes, all challenging each waterway’s primary function – drainage.
While experts agree that the 1993 event was a unique set of worst-case weather characteristics combining in the Upper Midwest, Changnon (1996: 300-319) drew a set of conclusions that included scientific and technical problems (monitoring and predicting flood conditions), incomplete or incorrect public information (especially during the flood), and the failure of past approaches to flood control and mitigation that emphasized structural and engineering solutions that in reality encouraged floodplain uses and created a false sense of security.
Thailand, 2011. Thailand’s agricultural production is largely dependent upon seasonal and “managed” flooding. Well into the 2011 monsoon season, however, Tropical Storm Nock-ten dropped heavy rain into northern Thailand while also pushing water toward the country’s coast, combining two hazard event components where the rainwater literally had nowhere to go:
The 2011 flood was different from most of the other flooding years in that it was driven by unusually high rainfall in the premonsoon (normally dry) season leading to unusually saturated soil moisture. Together with the lower basin’s drainage being constrained by the large increase in sea level height in the Gulf of Thailand, the flood became not only widespread but also prolonged (Promchote et al. 2016: 376).
The flooding lasted a remarkable 158 days and ended up affecting 66 of Thailand’s 77 provinces, killing a reported 813 people and causing more than $42 billion in property and economic losses (EM-DAT). While the 2011 event disrupted the national economy, it also had global effects because of Thailand’s place in a web of different supply chains affecting several hundred transnational companies, including auto and truck makers, parts suppliers, and electronics industries, particularly hard disk manufacturers where Thailand produced 40% of the global supply (Fry et al. 2013, Haraguchi and Lall 2015).
The Thai central government’s response was uncoordinated as floodwaters moved slowly south, but the emphasis on protecting the central areas of Bangkok meant that flood water went – and stayed for a long while – in the outskirts, which generated local conflicts with the central government and between local communities themselves. Marks and Lebel (2016: 61) noted that “local politicians and community leaders contested certain elite decisions and the scalar configuration of the flooding by protesting, attempting to destroy sandbag walls or pry open water gates, or by protecting their own areas.”
The primary takeaway for our equation from these two cases is that exposure increases over decades combined with inadequate vulnerability reductions meant that literally millions of people and billions of dollars in investment were put in harm’s way – and the trend seems set to continue as floodplains offer “open” areas for development. As climate change impacts accumulate and the flood hazard component of our equation becomes more unpredictable, the risk is actually increasing even faster than the mere exposure increases would indicate.
Cited References: Changnon, Stanley A., Editor, The Great Flood of 1993, Causes, Impacts, and Responses (Boulder, CO: Westview Press, 1996). Haraguchi, Masahiko and Upmanu Lall, “Flood risks and impacts: A case study of Thailand’s floods in 2011 and research questions for supply decision making,” International Journal of Disaster Risk Reduction 14 (2015) 256-272. Koellner 1996 XXXXXXXXXXXX. Marks, Danny and Louis Lebel, “Disaster governance and the scalar politics of incomplete decentralization: Fragmented and contested responses to the 2011 floods in Central Thailand,” Habitat International 52 (2016): 57-66. Promchote, Parichart, S. Y. Simon Wang, and Paul G. Johnson, “The 2011 Great Flood in Thailand: Climate Diagnostics and Implications from Climate Change,” Journal of Climate 29 (January 2016): 367-379.

- Richard S. Olson, Ph.D.