Hazard: Earthquake

Country: Haiti

H
[ Hazard ]
HAITI

Event Date

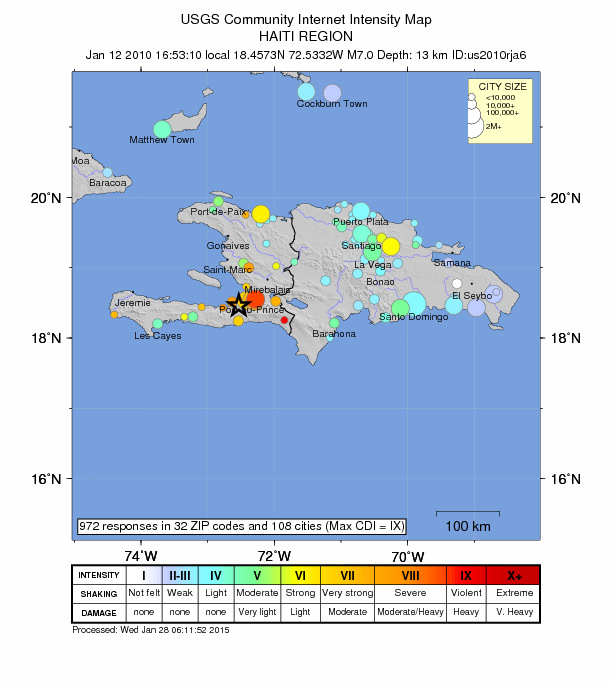
January 12, 2010

Moment Magnitude Scale (Mw)

7.0

Modified Mercalli Intensity Scale (MMI)

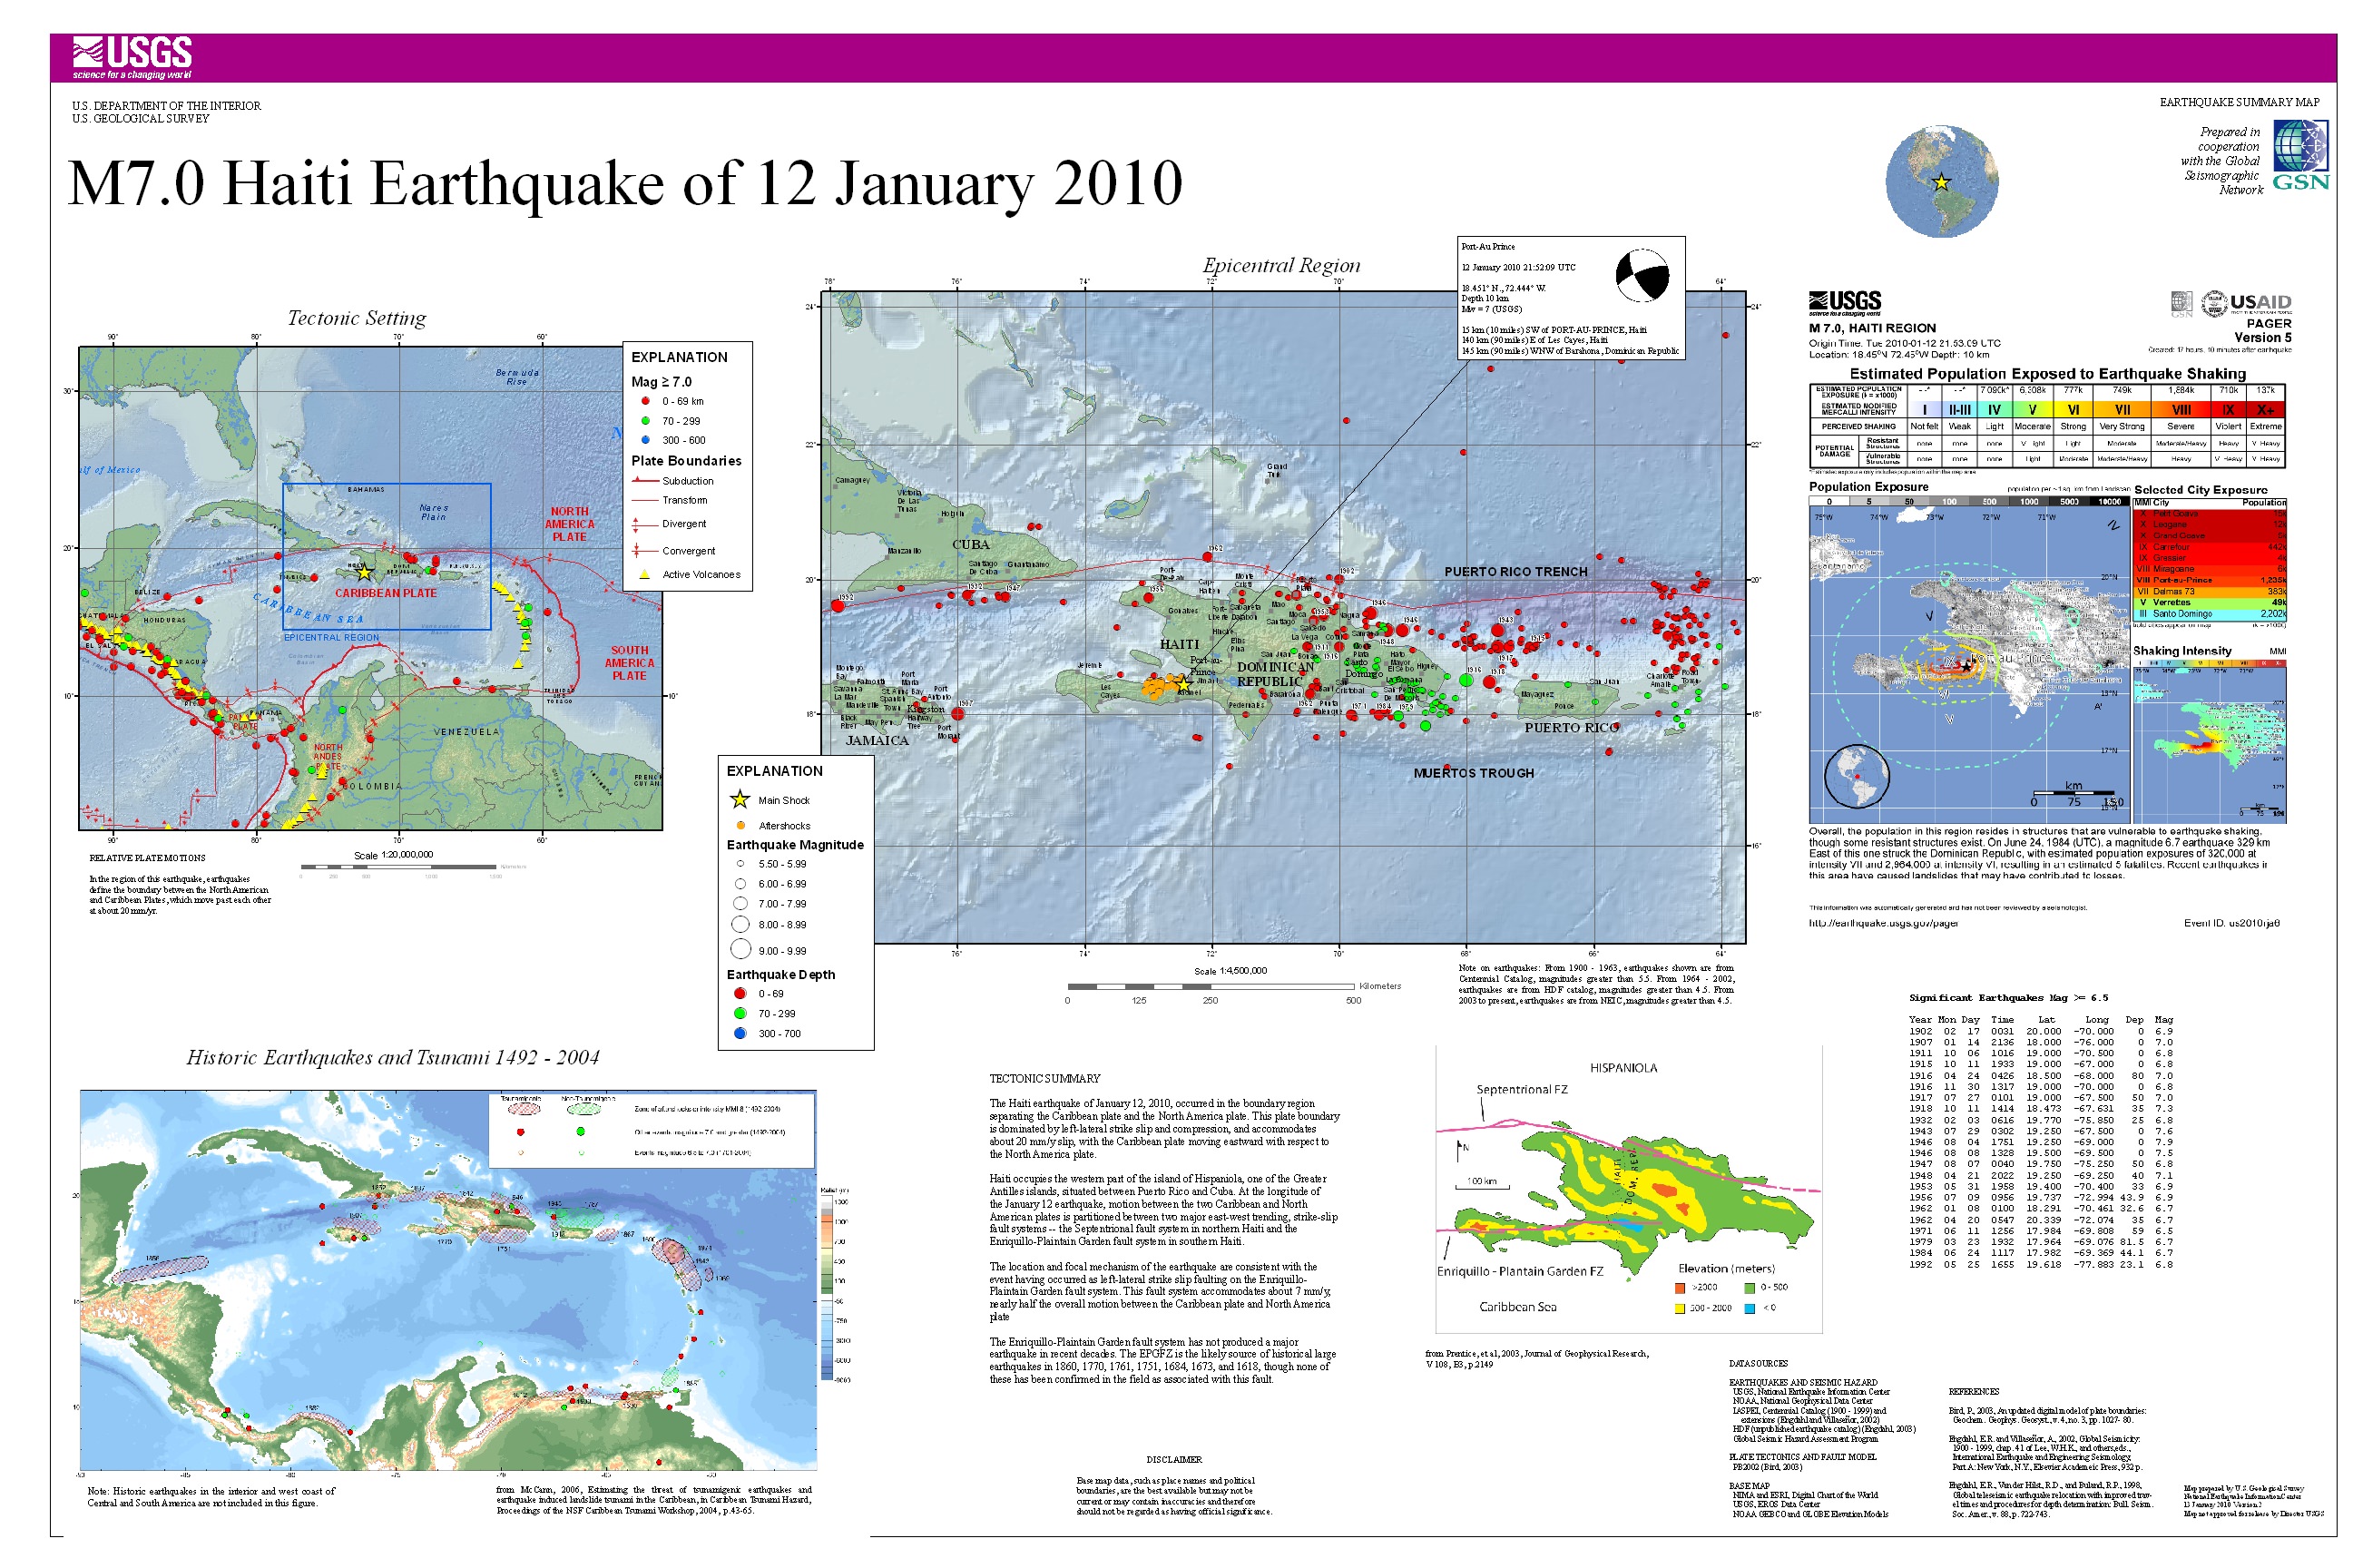
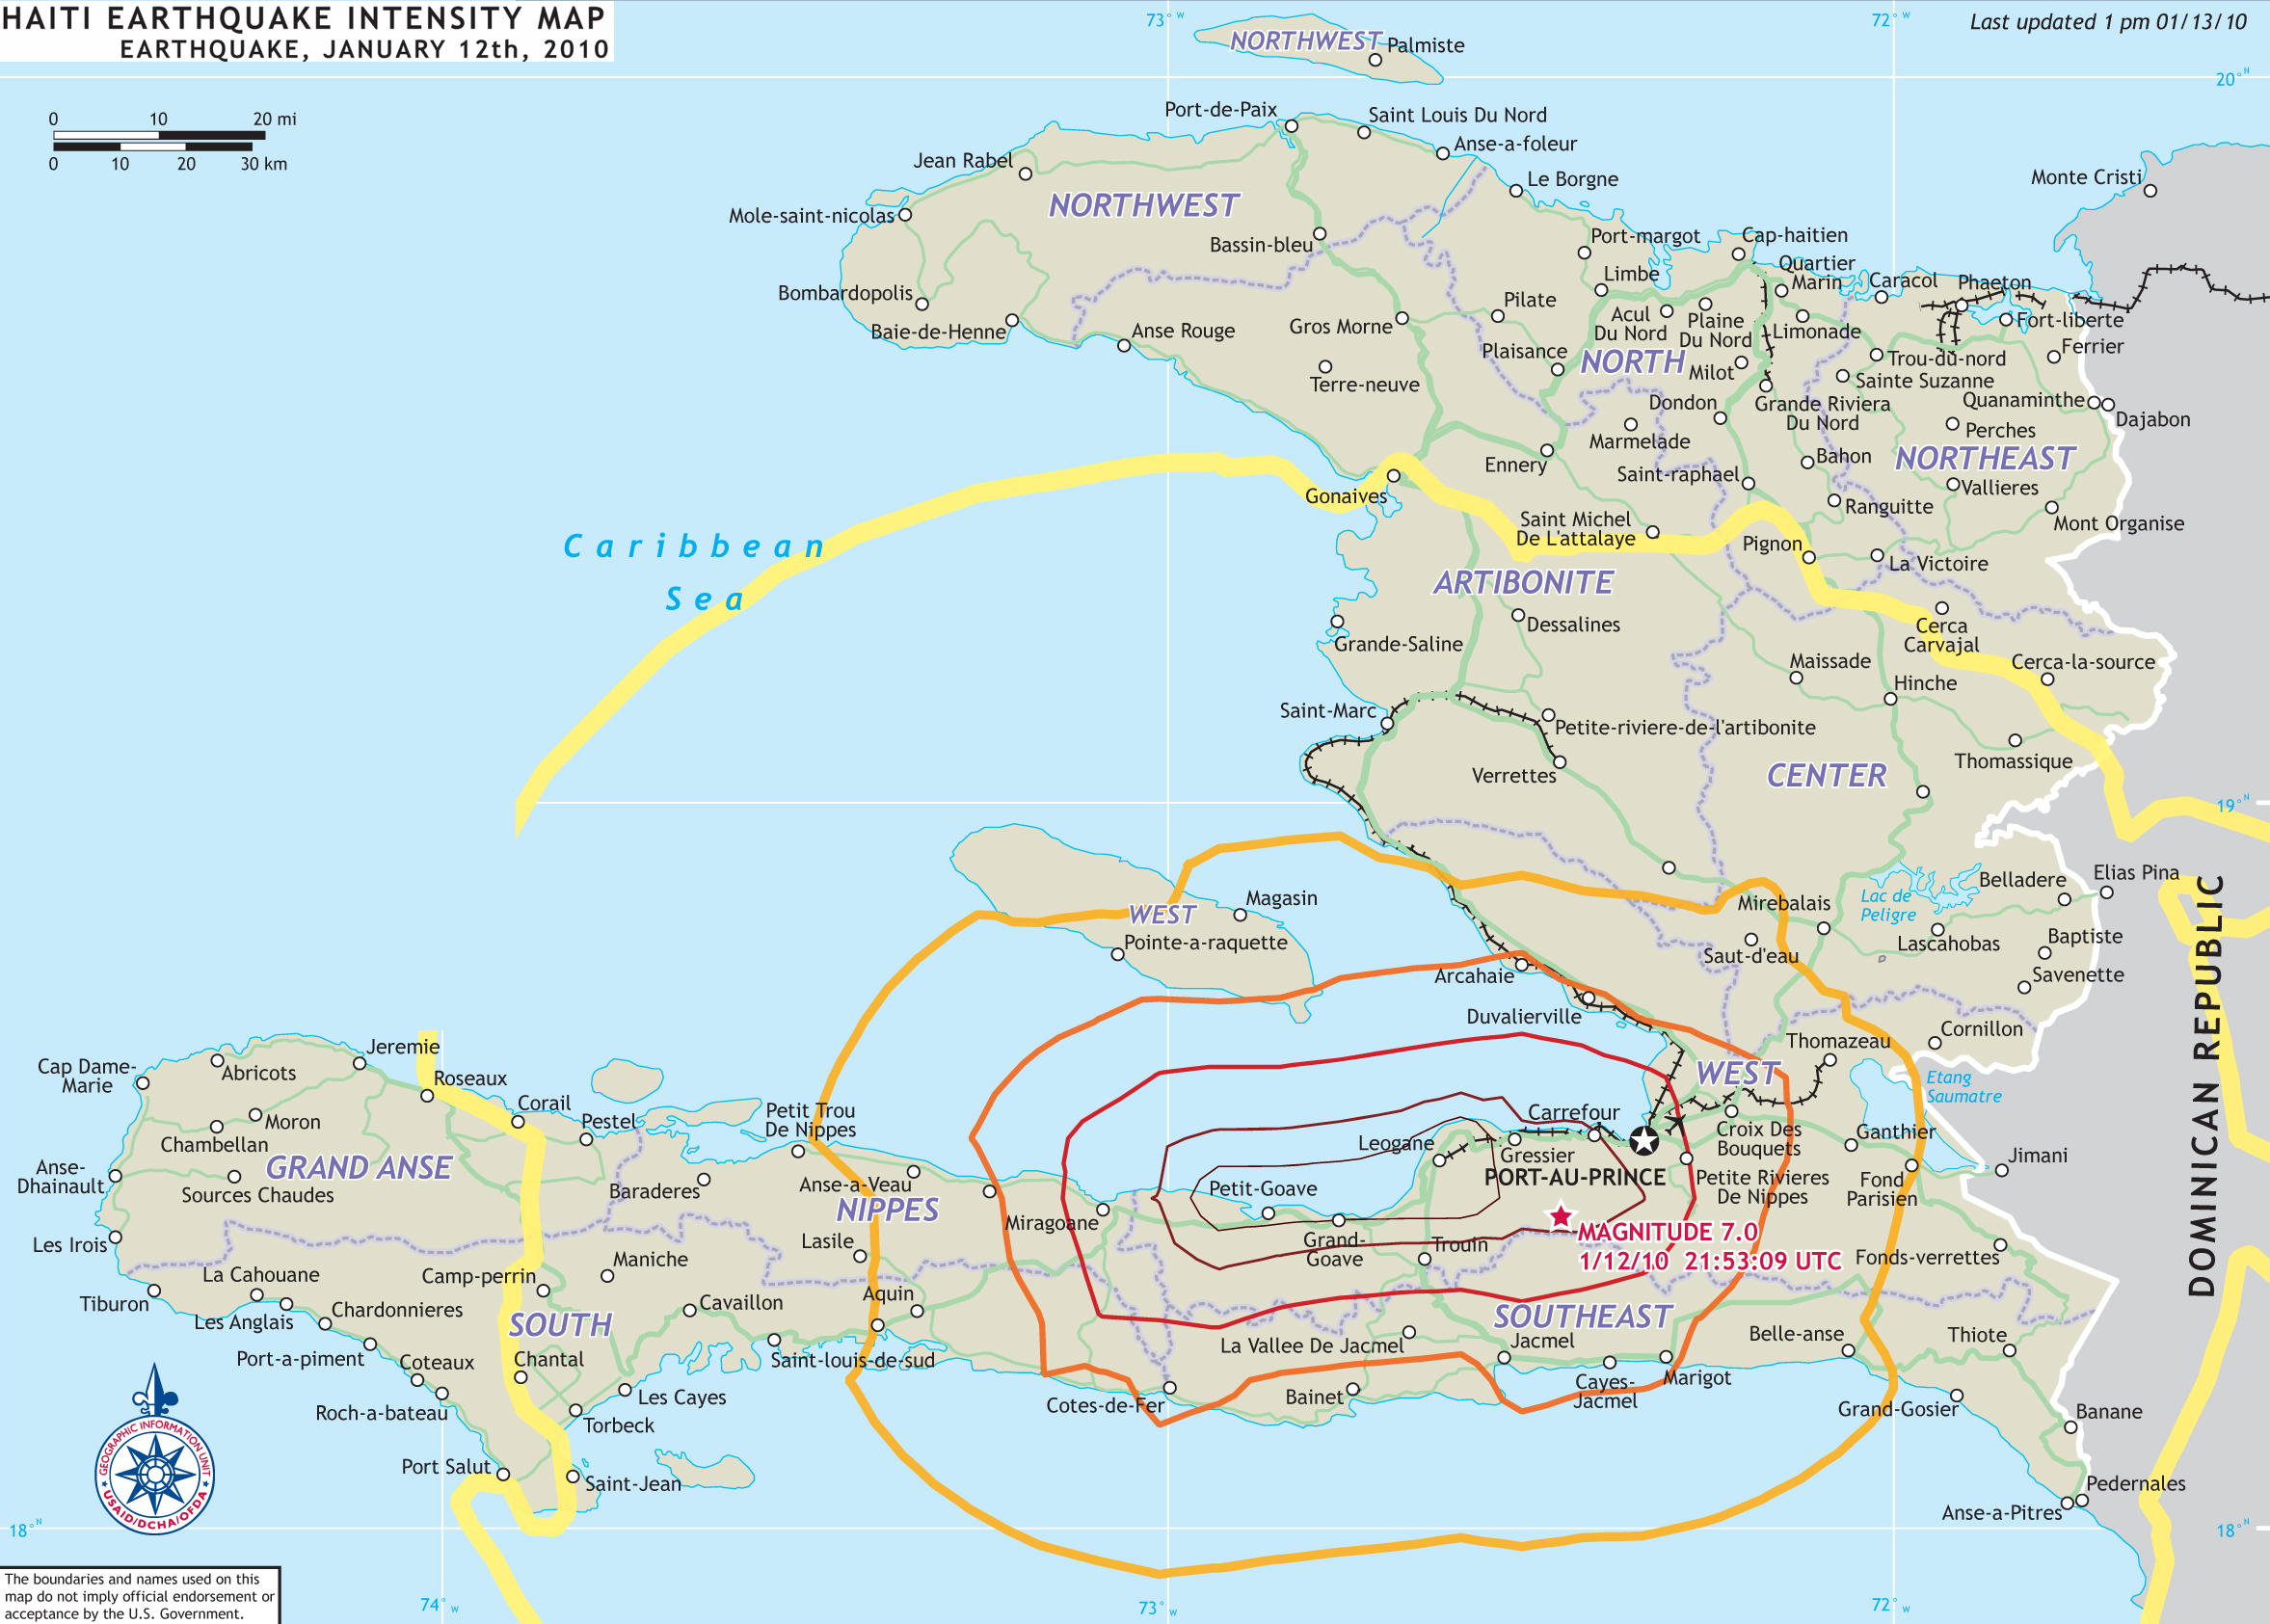
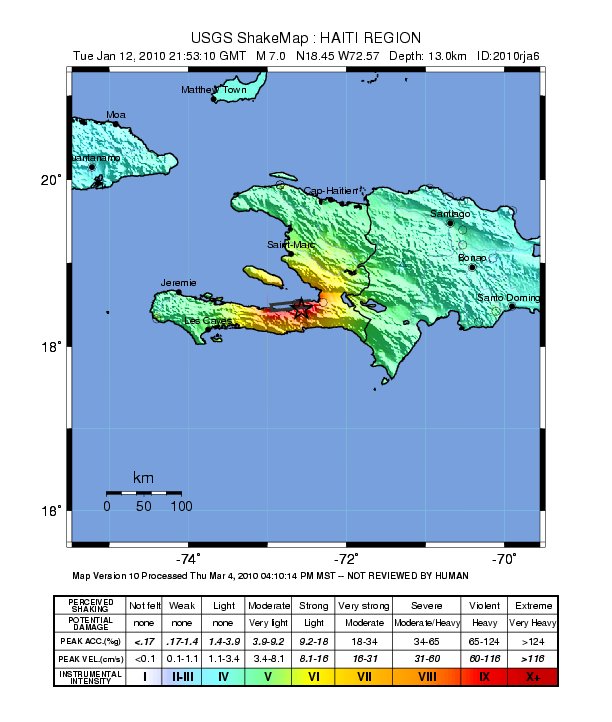
X (Extreme) at Petit Goave
X (Extreme) at Grand Goave
X (Extreme) at Gressier
IX (Violent) at Leogane
IX (Violent) at Carrefour
VIII (Severe) at Miragoane
VIII (Severe) at Port-au-Prince
VIII (Severe) at Delmas

Notable Features

Depth: 8.1 miles (13 km)
Time: 21:53:10 UTC
Epicenter: 18.443°N, 72.571°W, 15 miles (25 km) SW of Port-Au-Prince, Haiti
Tectonic Feature: Enriquillo–Plantain Garden Fault Zone

Source(s)

US Geological Survey

Videos  Gallery 
Hazard: Earthquake

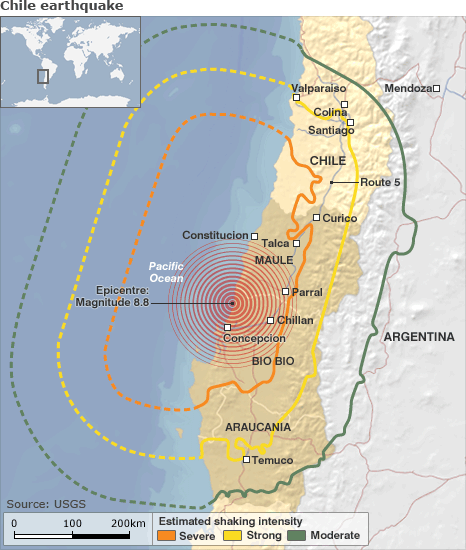
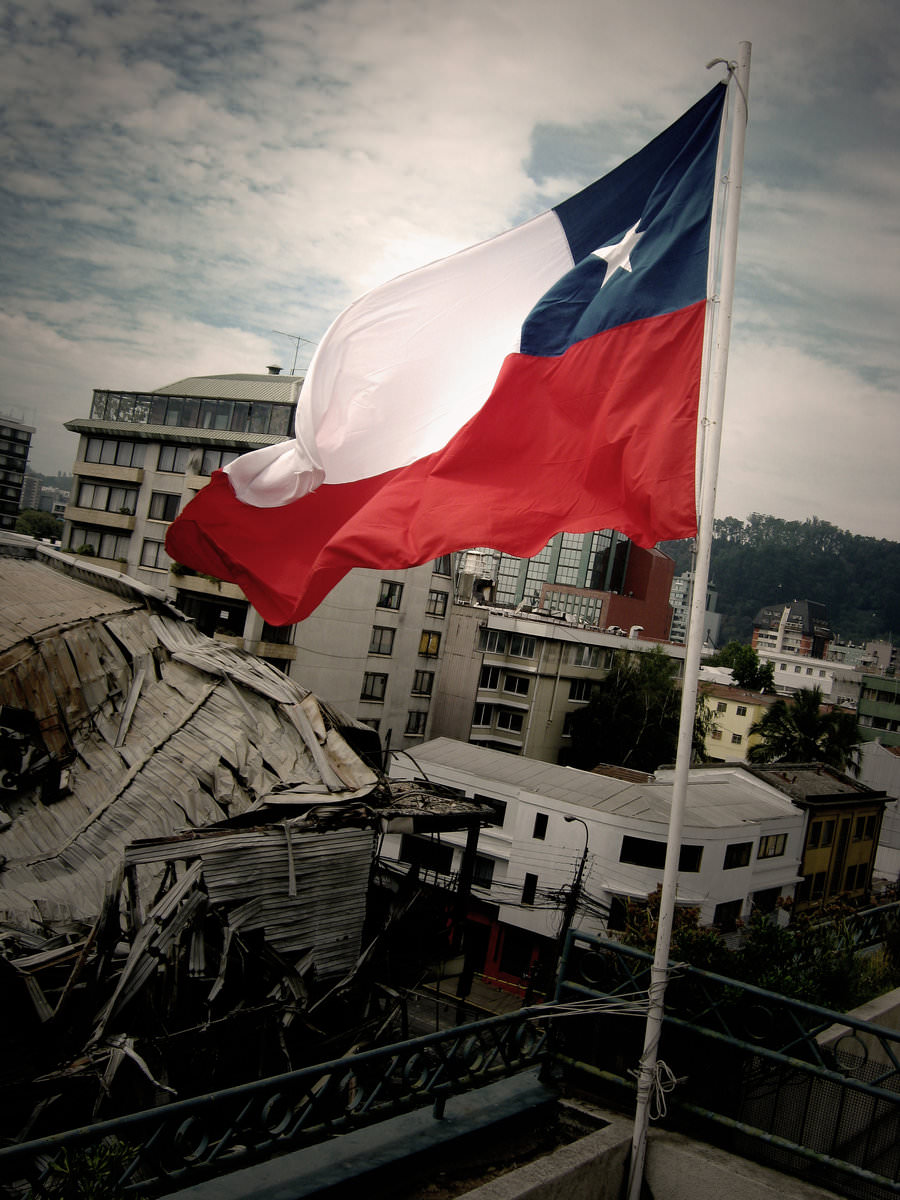
Country: Chile

H
[ Hazard ]
CHILE

Event Date

February 27, 2010

Moment Magnitude Scale (Mw)

8.8

Modified Mercalli Intensity Scale (MMI)

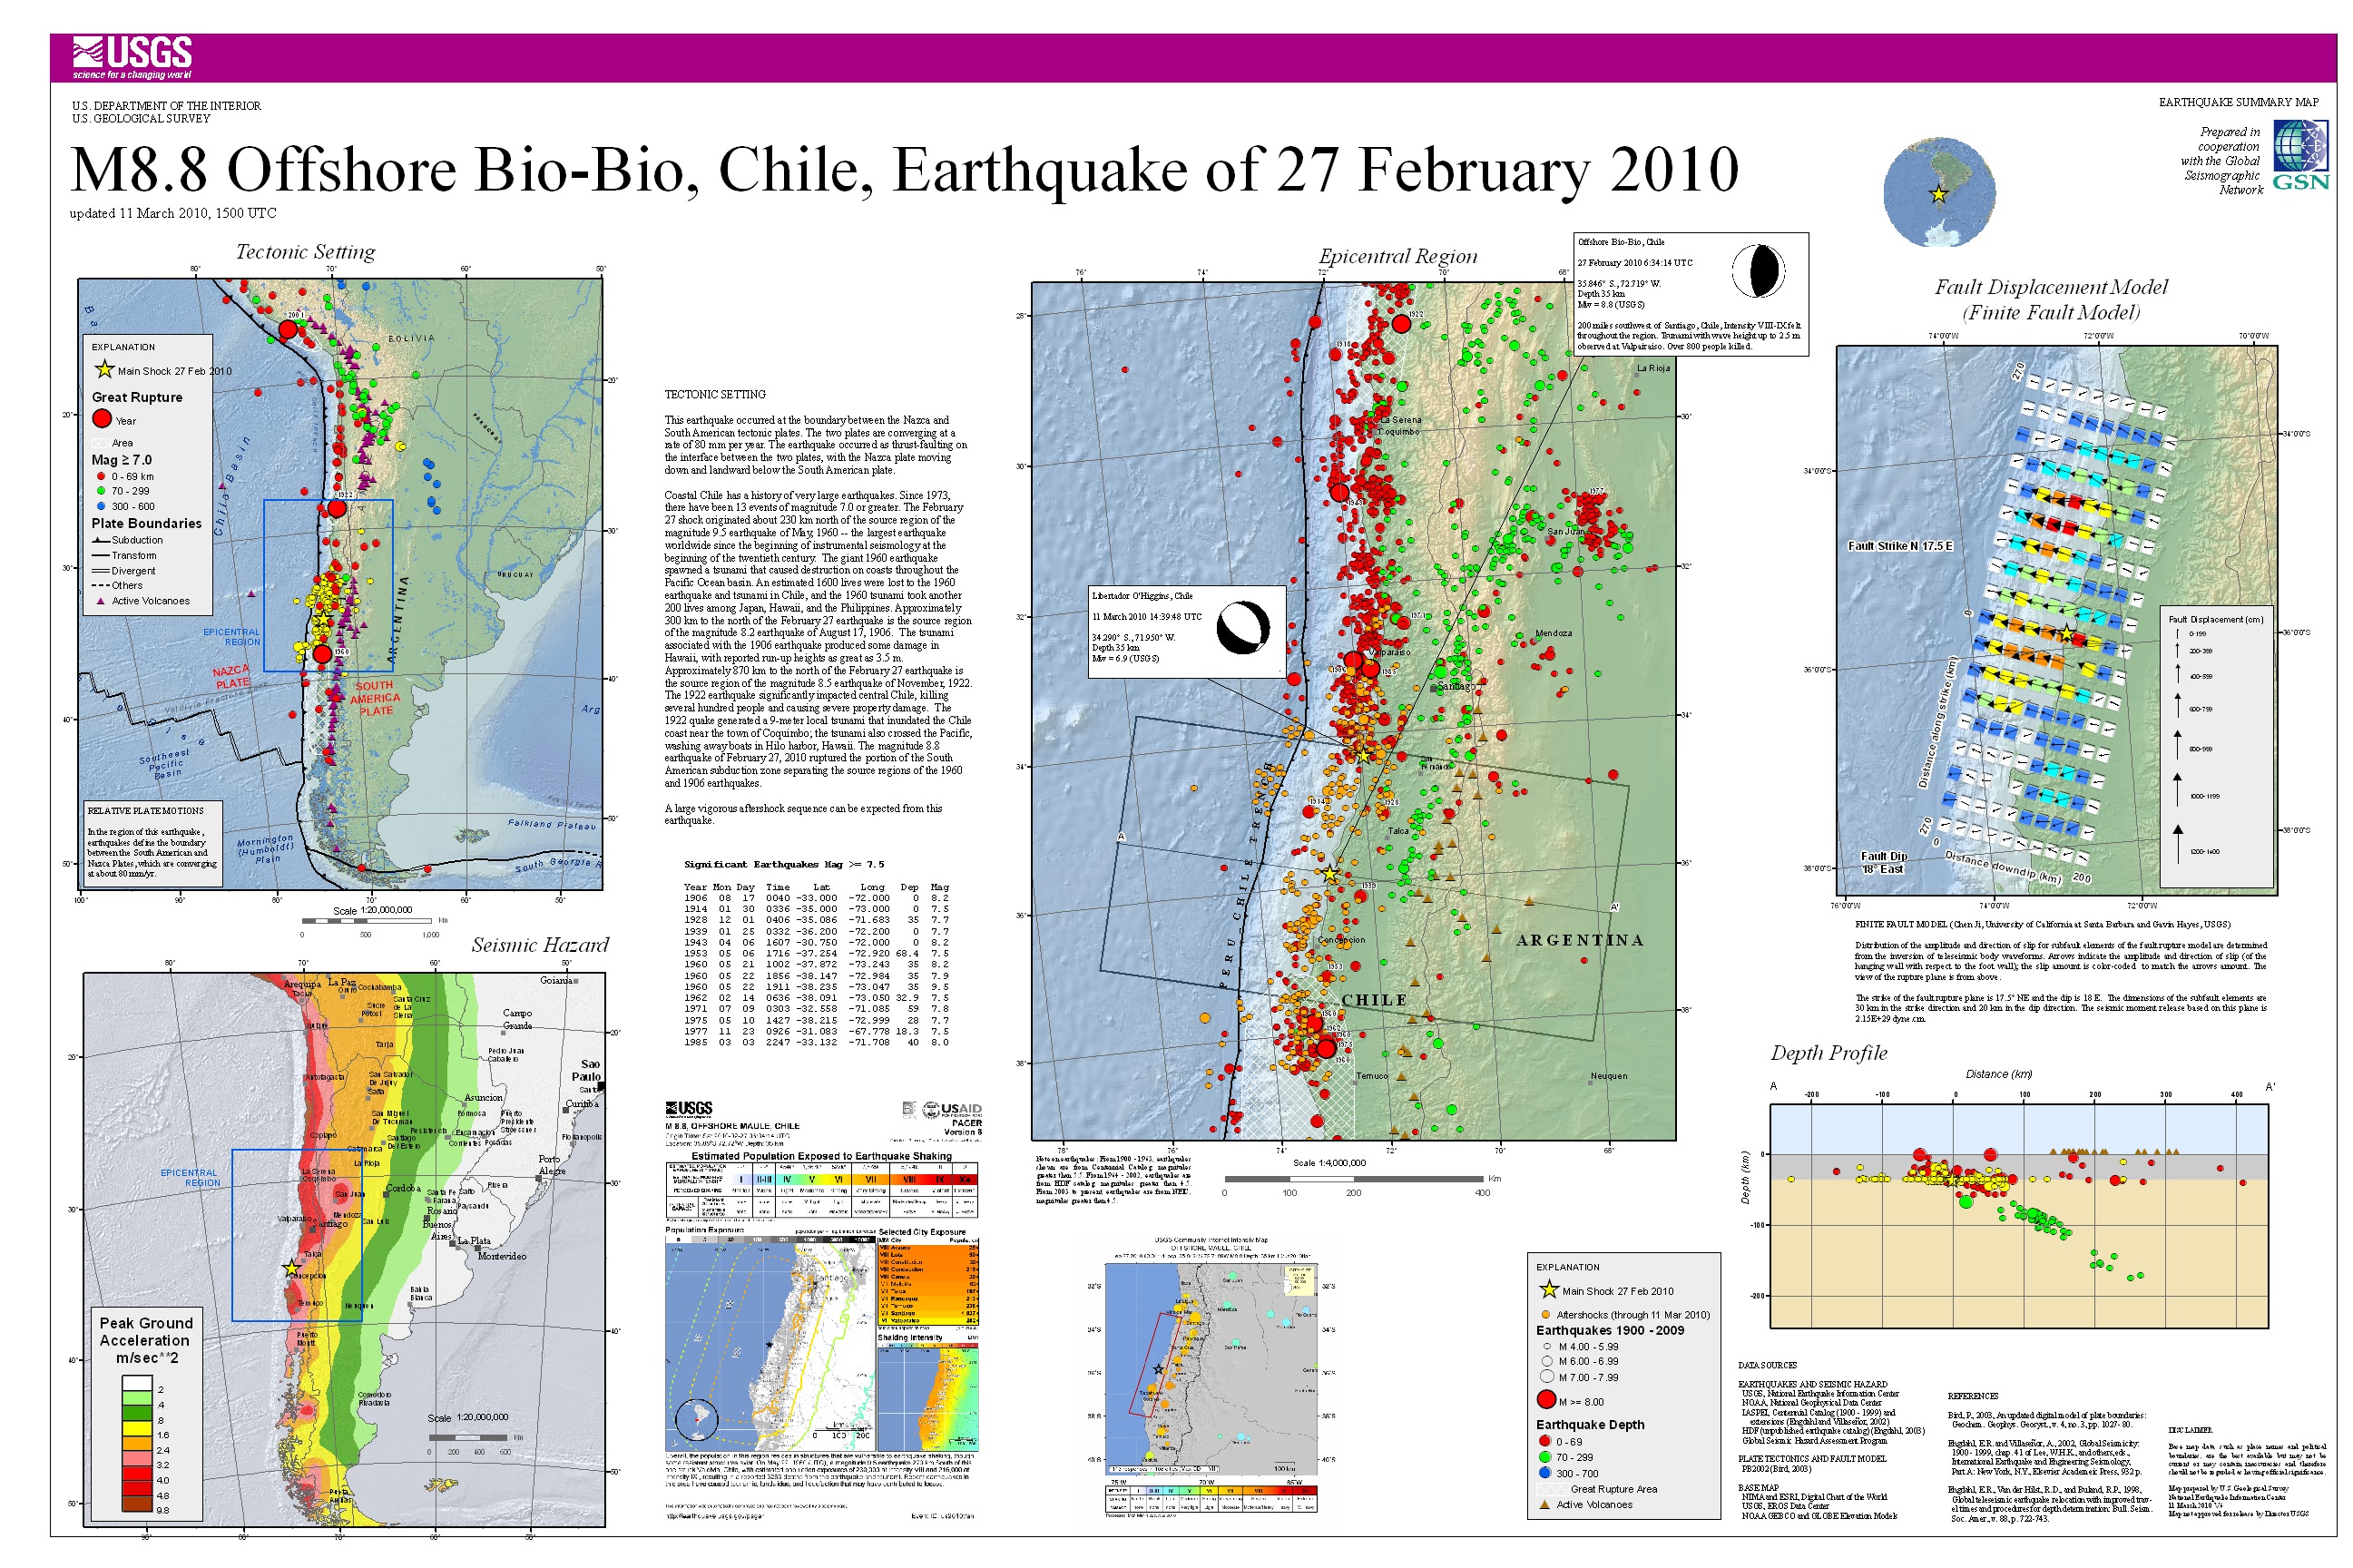
VIII (Severe) at Cabrero
VIII (Severe) at Arauco
VIII (Severe) at Tome
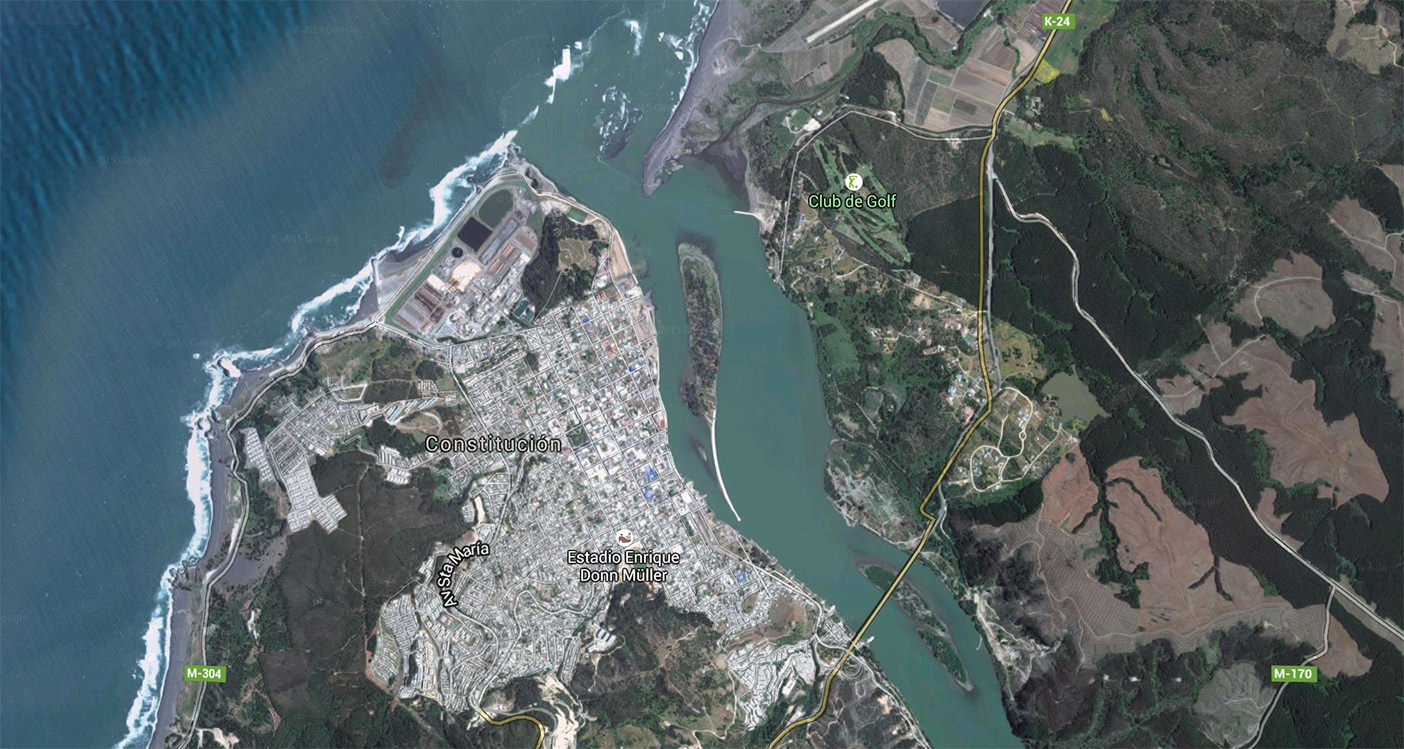
VIII (Severe) at Constitucion
VIII (Severe) at Concepcion
VIII (Severe) at Caranilahue

Notable Features

Depth: 21.7 miles (35 km)
Time: 06:34:14 UTC
Epicenter: 35.909°S, 72.733°W, 65 miles (105 km) NE of Concepcion, Chile
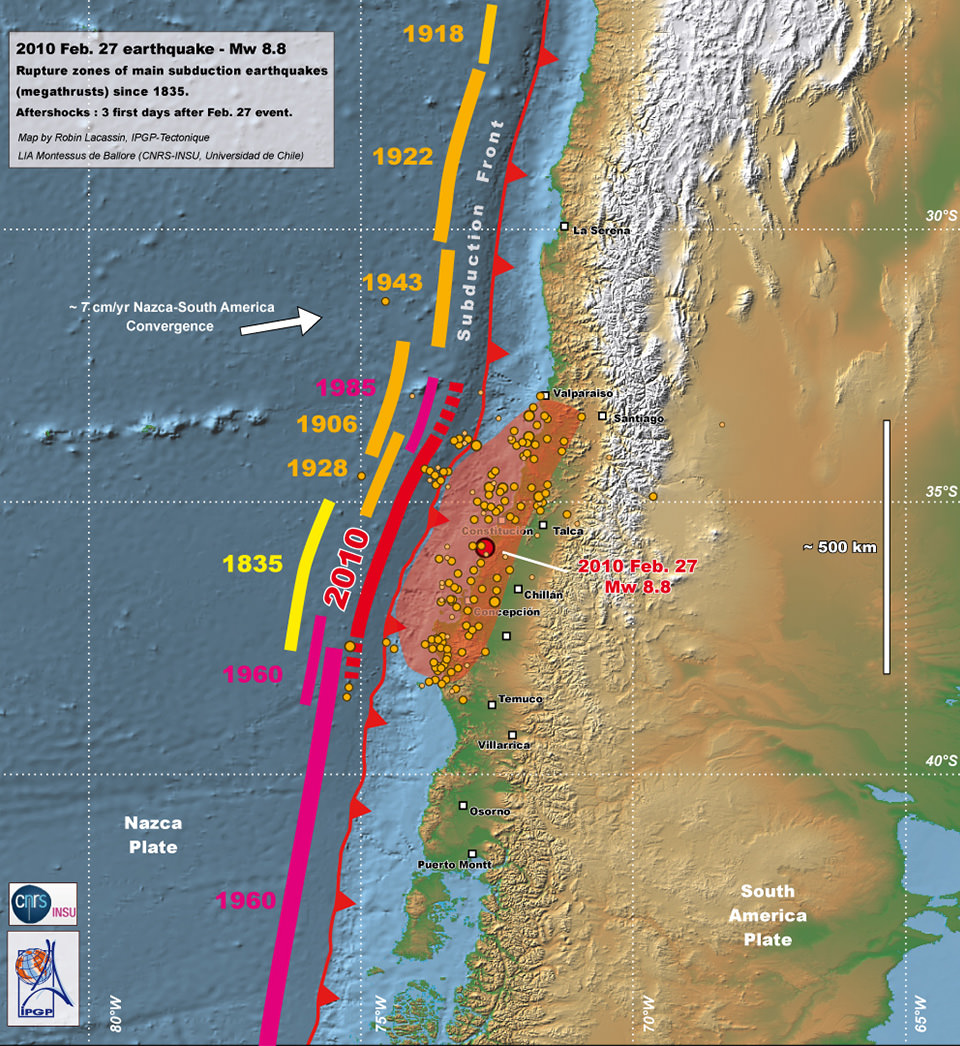
Tectonic Feature: Nazca and South American Plates
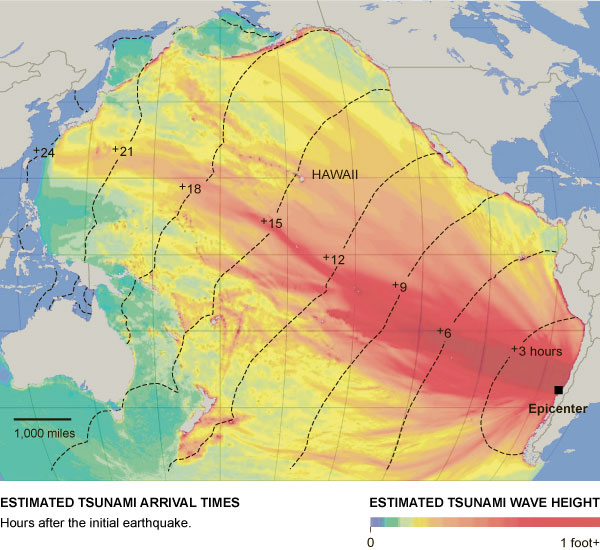
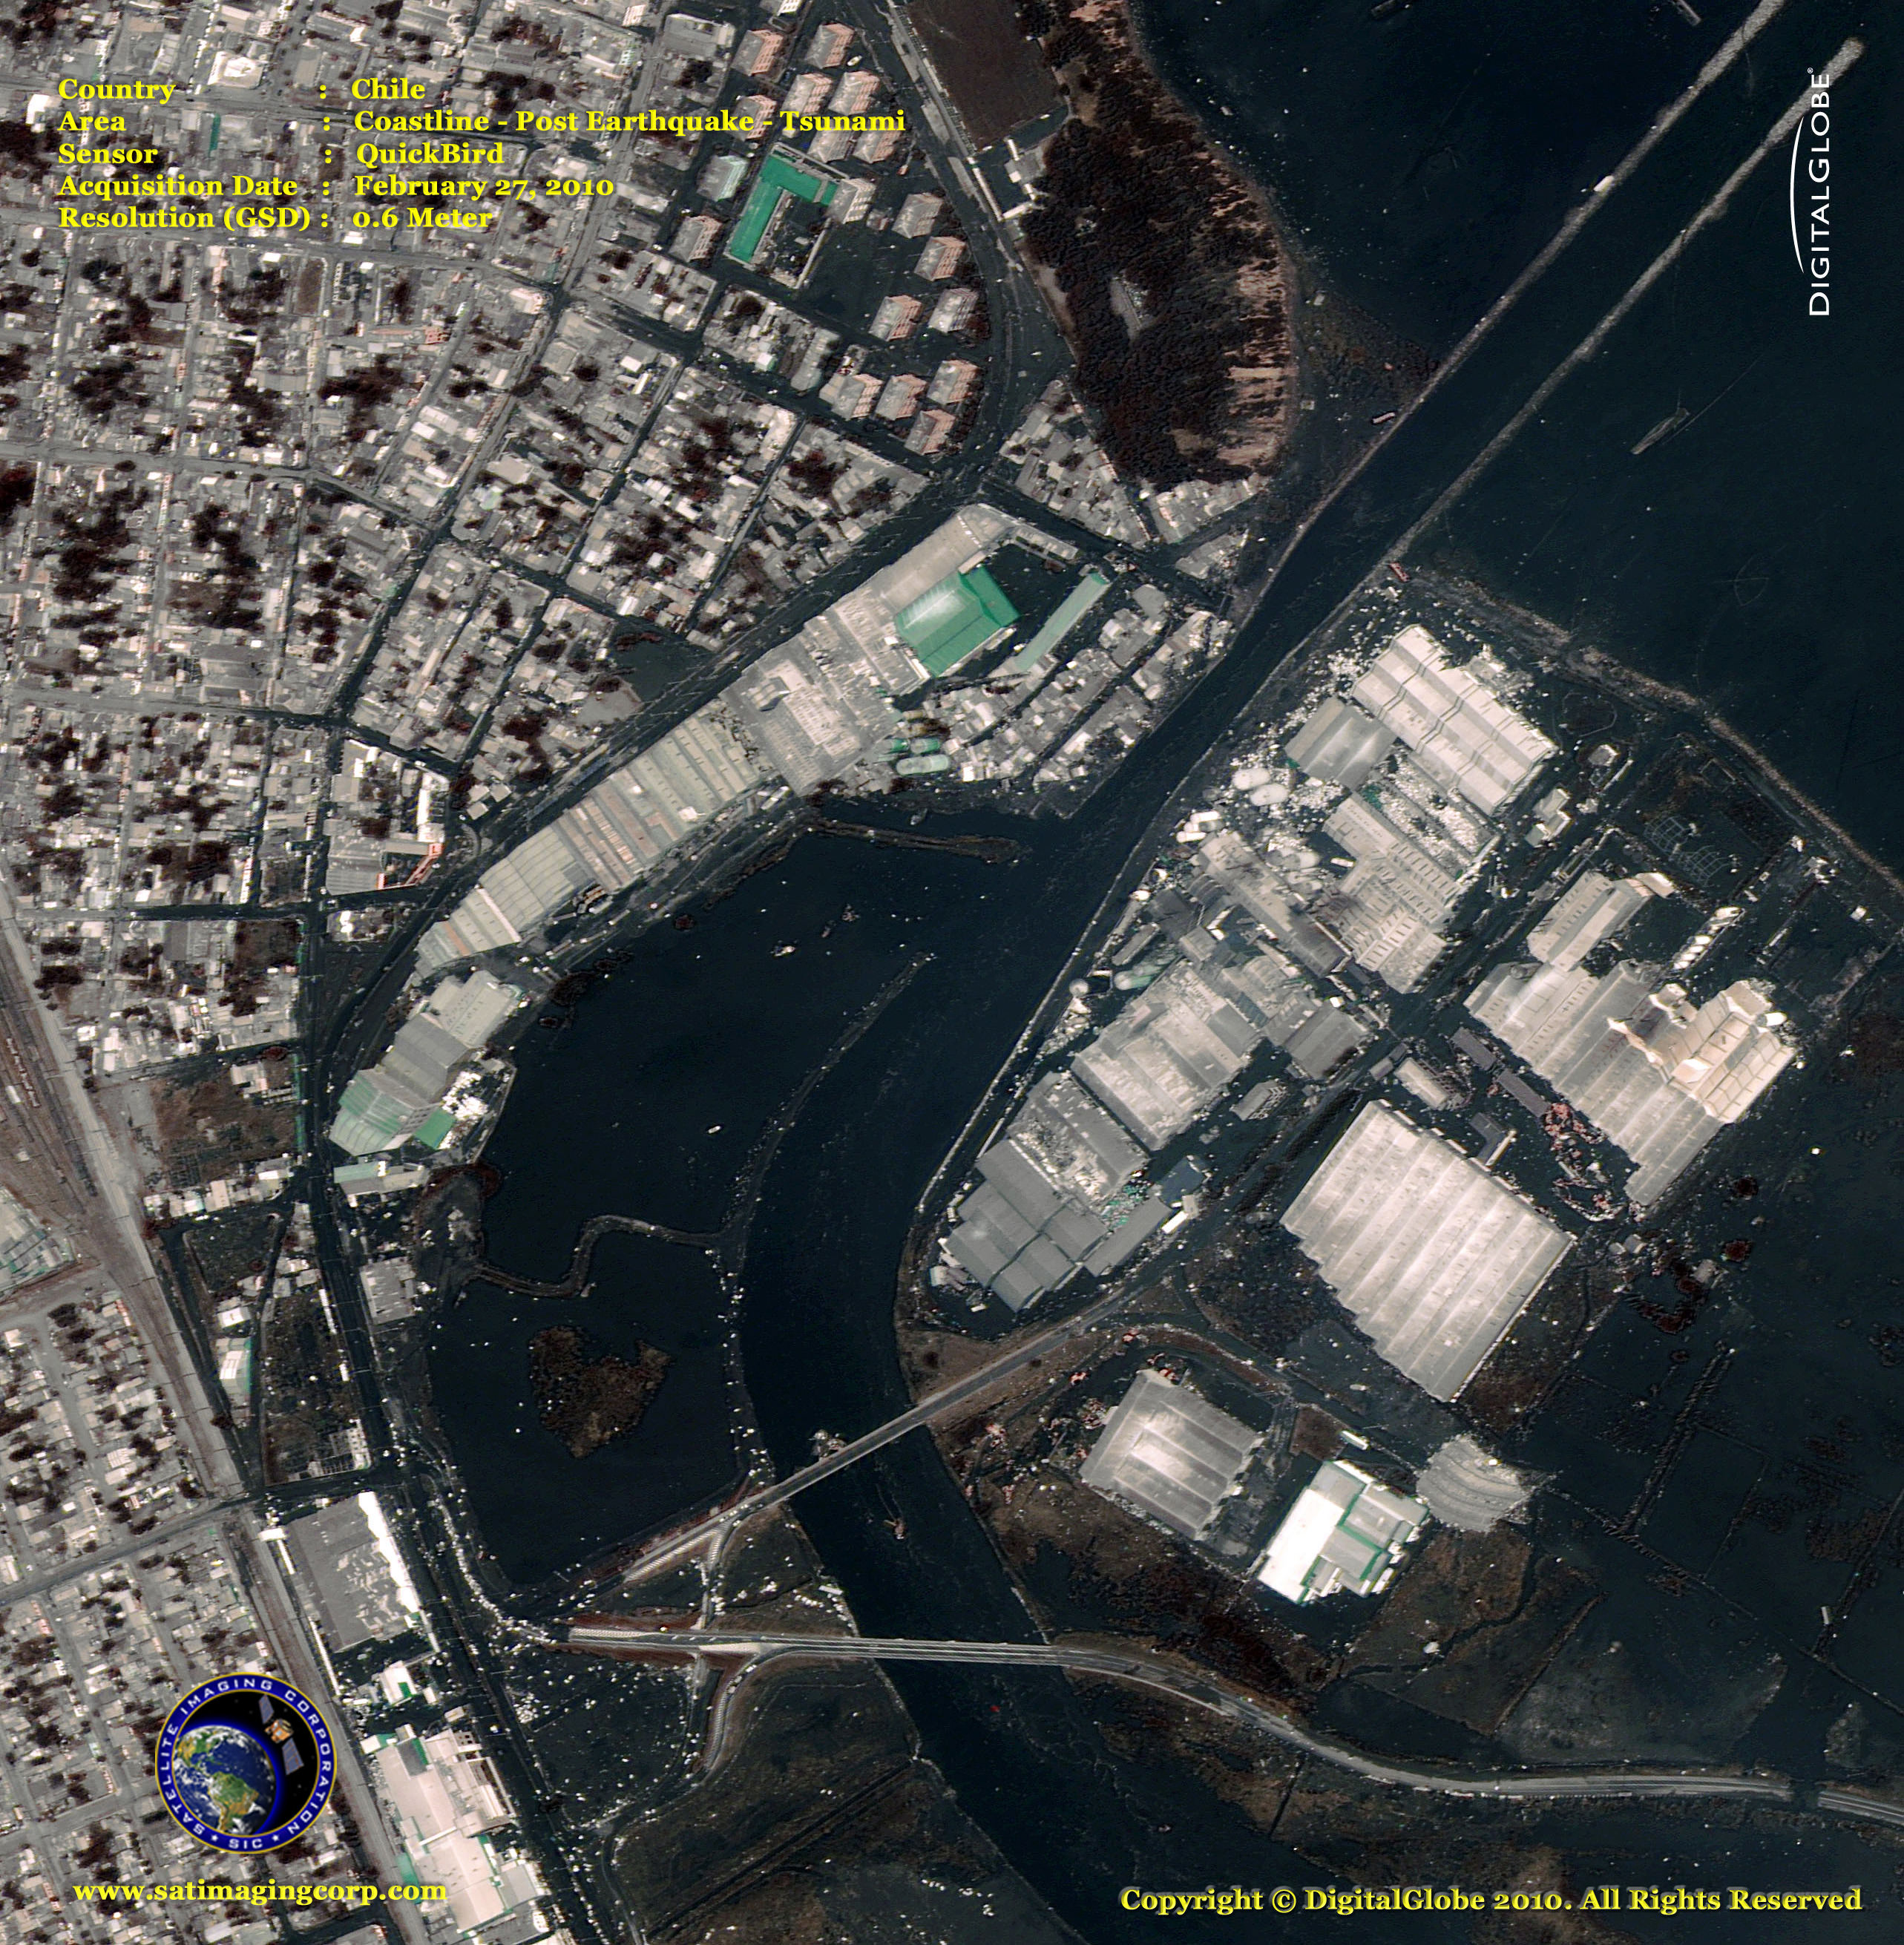
Tsunami - Maximum Wave Height: 8.50 feet above sea level recorded in Valparaiso.

Source(s)

• US Geological Survey

Videos  Gallery 
Ex
[ Exposures ]
HAITI

Principal Area of Impact

Port-Au-Prince / Southwestern Haiti

Population Prior to the Event

4.459 Million Estimated (Southwestern Haiti)

Previous Year’s Gross Domestic Product (GDP)

$6.585 Billion USD (2009)

Previous Year’s Gross Domestic Product Per Capita

$674.30 USD (2009)

Source(s)

• US Geological Survey
• World Bank Group

Videos  Gallery 
Ex
[ Exposures ]
CHILE

Principal Area of Impact

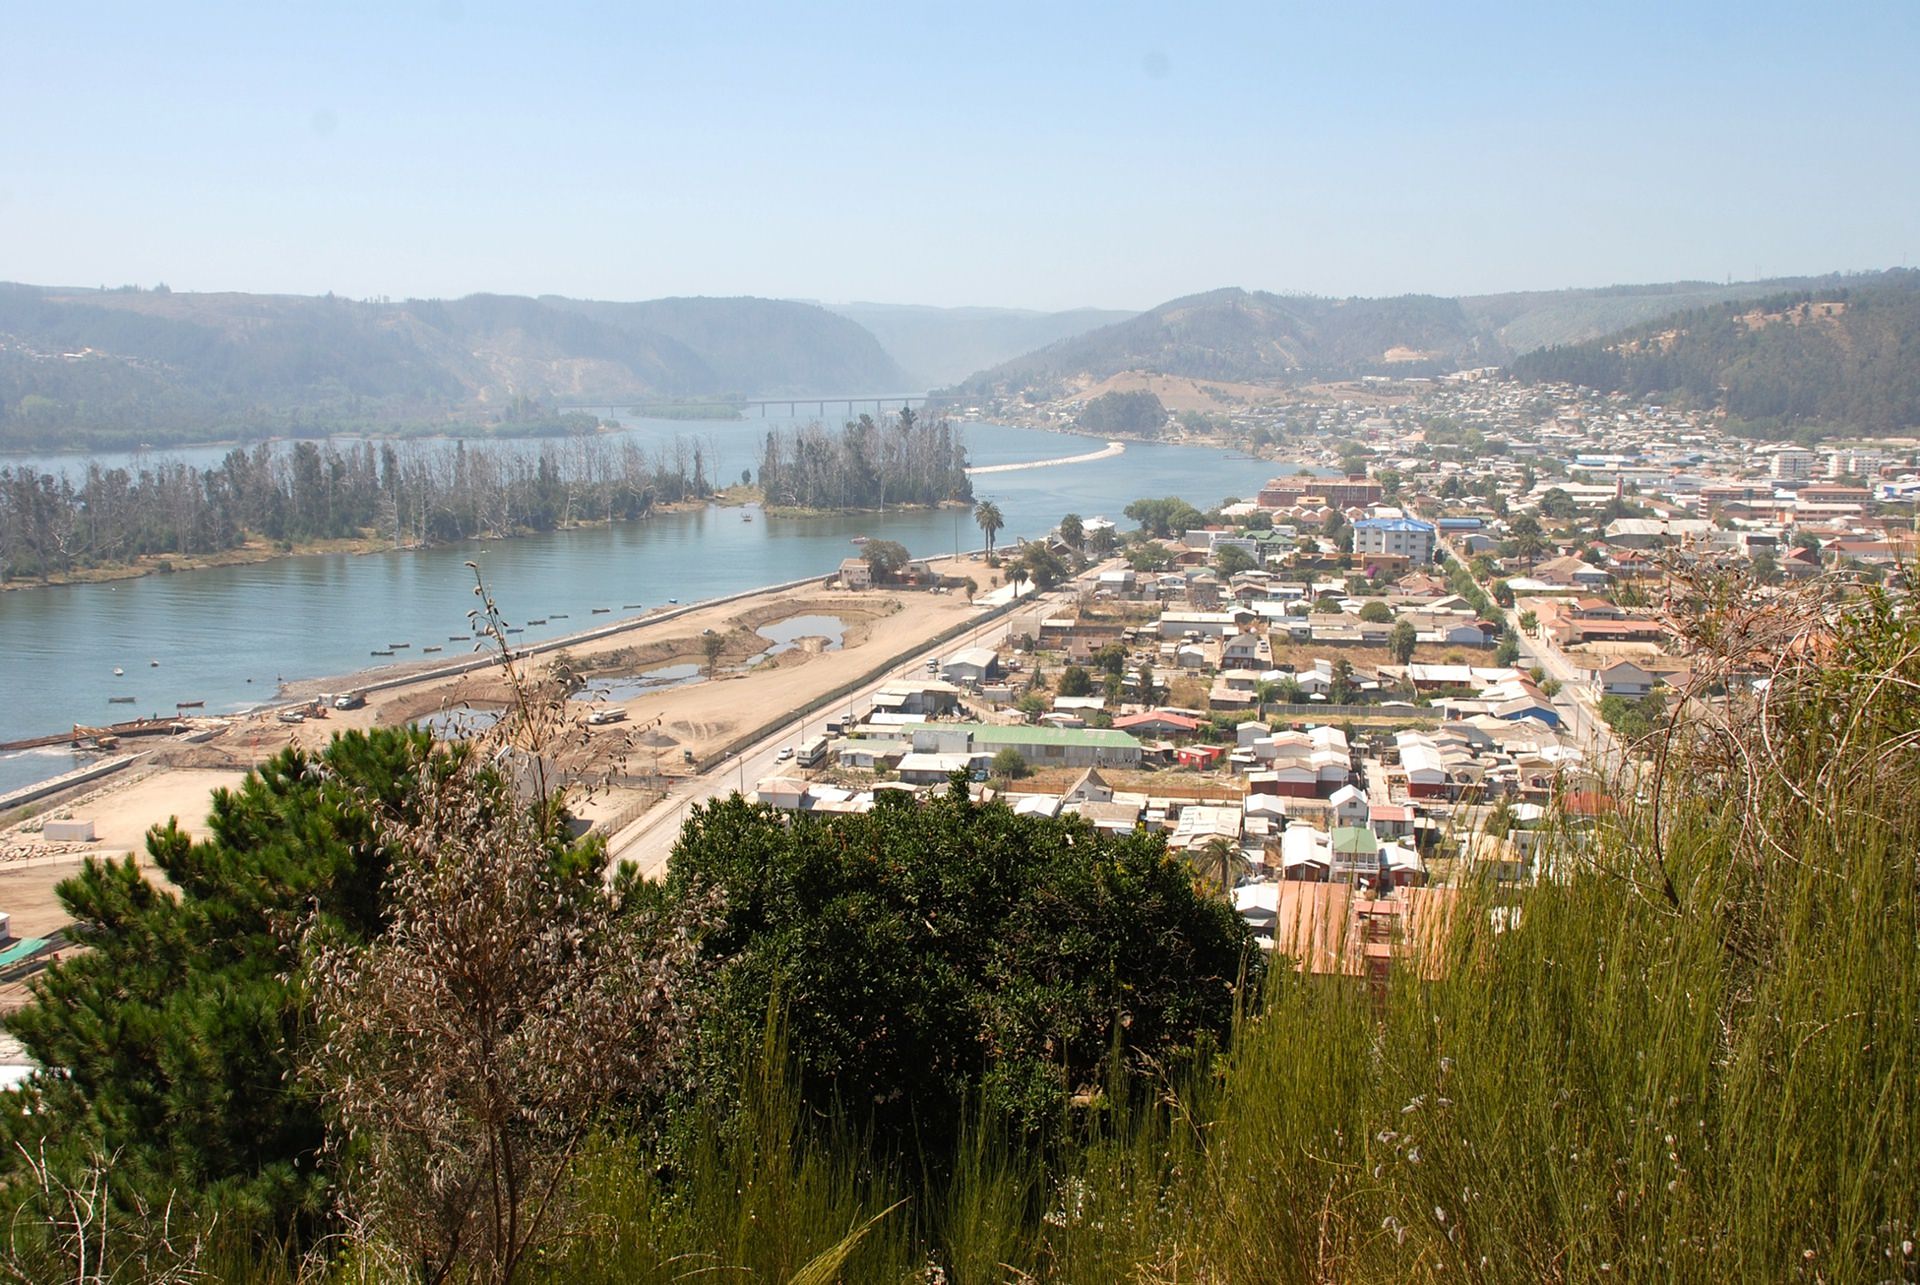
Concepcion and Constitucion / Central Chile

Population Prior to the Event

13.656 Million Estimated (Central Chile)

Previous Year’s Gross Domestic Product (GDP)

$172.3 Billion USD (2009)

Previous Year’s Gross Domestic Product Per Capita

$10,141.60 USD (2009)

Source(s)

• US Geological Survey
• World Bank Group

Videos  Gallery 
V
[ Vulnerabilities ]
HAITI

Governance

World Bank Group Indicator –
Regulatory Quality (Percentile Rank):

20.1 (2009)

World Bank Group Indicator -Government Effectiveness (Percentile Rank):
3.3 (2009)

World Bank Group Indicator –
Rule of Law (Percentile Rank):
5.2 (2009)

World Bank Group Indicator – Voice and Accountability (Percentile Rank):
29.9 (2009)

World Bank Group Indicator – Political Stability and Absence of Violence (Percentile Rank):
16.6 (2009)

Corruption

World Bank Group Indicator – Control of Corruption (Percentile Rank):
11 (2009)

Transparency International Corruption Perception Index Score:
1.8 (2009)

Transparency International Corruption Perception Index Rank:
168 out of 180 (2009)

Development

World Bank Group - GINI Index:
Not Available

Human Development Index Score (HDI):
0.532 (2007)

Human Development Index Rank (HDI):
149 out of 182 (2007)

Source(s)

• World Bank Group
• Transparency International
• UNDP Human Development Report 2009

Videos  Gallery 
V
[ Vulnerabilities ]
CHILE

Governance

World Bank Group Indicator –
Regulatory Quality (Percentile Rank):

92.8 (2009)

World Bank Group Indicator -Government Effectiveness (Percentile Rank):
85.2 (2009)

World Bank Group Indicator –
Rule of Law (Percentile Rank):
87.7 (2009)

World Bank Group Indicator – Voice and Accountability (Percentile Rank):
78.7 (2009)

World Bank Group Indicator – Political Stability and Absence of Violence (Percentile Rank):
67.3 (2009)

Corruption

World Bank Group Indicator – Control of Corruption (Percentile Rank):
89 (2009)

Transparency International Corruption Perception Index Score:
6.7 (2009)

Transparency International Corruption Perception Index Rank:
25 out of 180 (2009)

Development

World Bank Group - GINI Index:
52 (2009)

Human Development Index Score (HDI):
0.878 (2007)

Human Development Index Rank (HDI):
44 out of 182 (2007)

Source(s)

• World Bank Group
• Transparency International
• UNDP Human Development Report 2009

Videos  Gallery 
EmR
DR
CatR

[Risk]
HAITI

Total Affected Population

3,700,000

  • Total Deaths
    222,570
  • Injured
    300,000
  • Homeless
    Not Available

Total Damage

$8.72 Billon (In 2015 USD)

Source(s)

• EM-DAT
• CPI Inflation Calculator

Videos  Gallery 
EmR
DR
CatR

[Risk]
CHILE

Total Affected Population

2,671,556

  • Total Deaths
    562
  • Injured
    10,334
  • Homeless
    800,000

Total Damage

$32.7 Billion (In 2015 USD)

Source(s)

• EM-DAT
• CPI Inflation Calculator

Videos  Gallery 

Takeaways

Major earthquakes are not unusual in the Latin America and Caribbean region, but to have two major events in the region only six weeks apart is unusual. To have those events affecting two countries, Haiti and Chile, at extraordinarily different development levels is even more unusual – and very instructive from a comparative, but really a contrasting, perspective. The January 12, 2010 earthquake that primarily affected Haiti’s capital, Port-au-Prince (with its environs the event’s principal zone of human impact), was clearly and from the outset a catastrophe. The February 27, 2010 earthquake and accompanying tsunami that primarily affected two southcentral regiones (provinces) in Chile is best understood as a more limited “disaster” for that event’s principal zone of human impact. While both hazard events were earthquakes, the vastly contrasting impacts, both short and long term, resulted from very different exposures and, particularly, vulnerability levels.

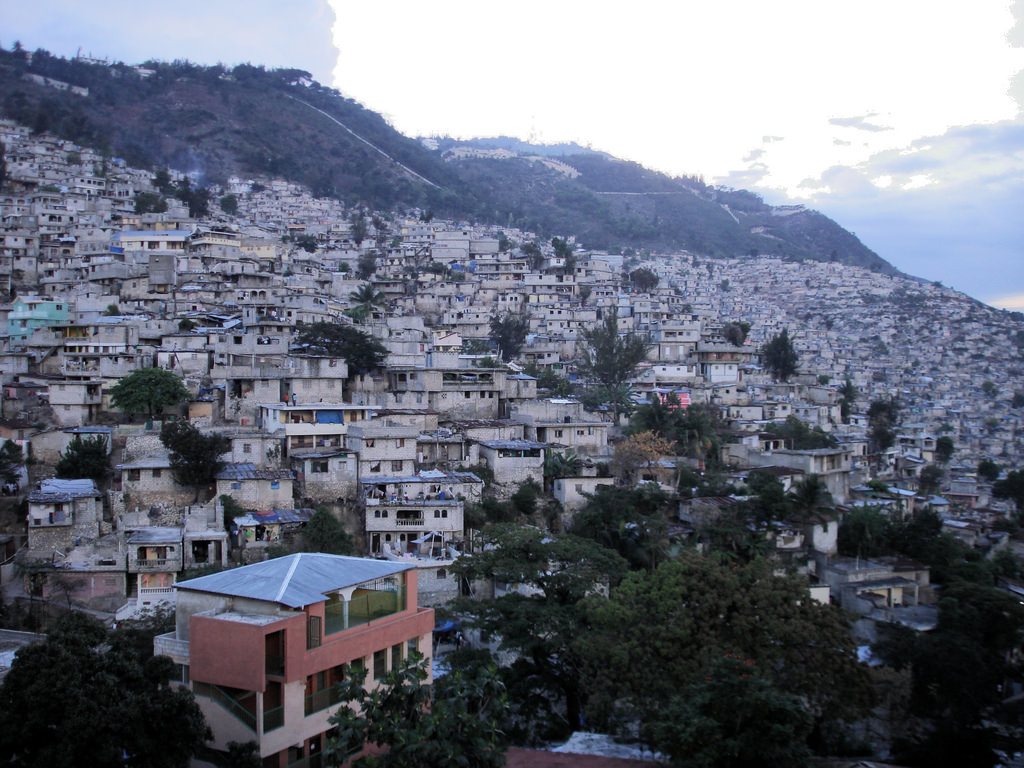
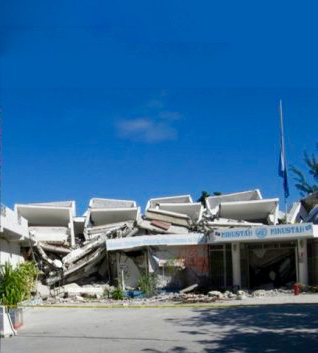
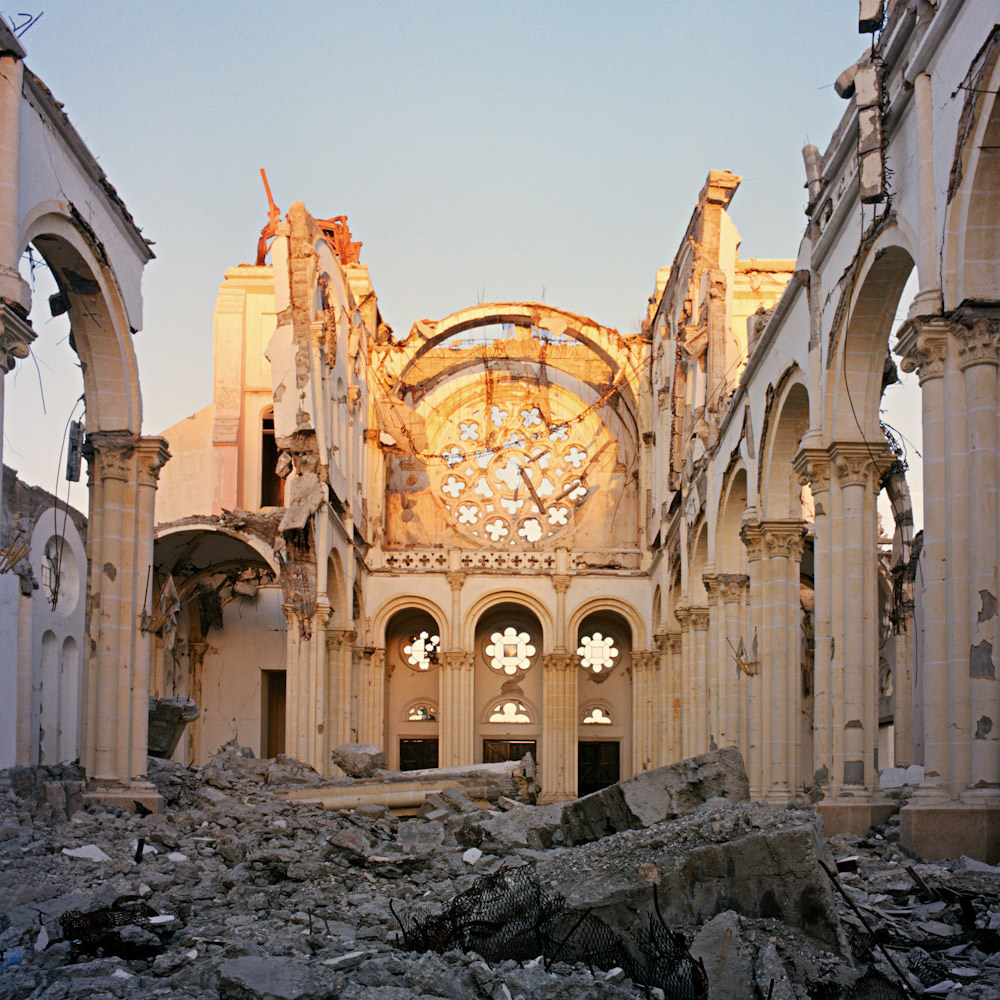
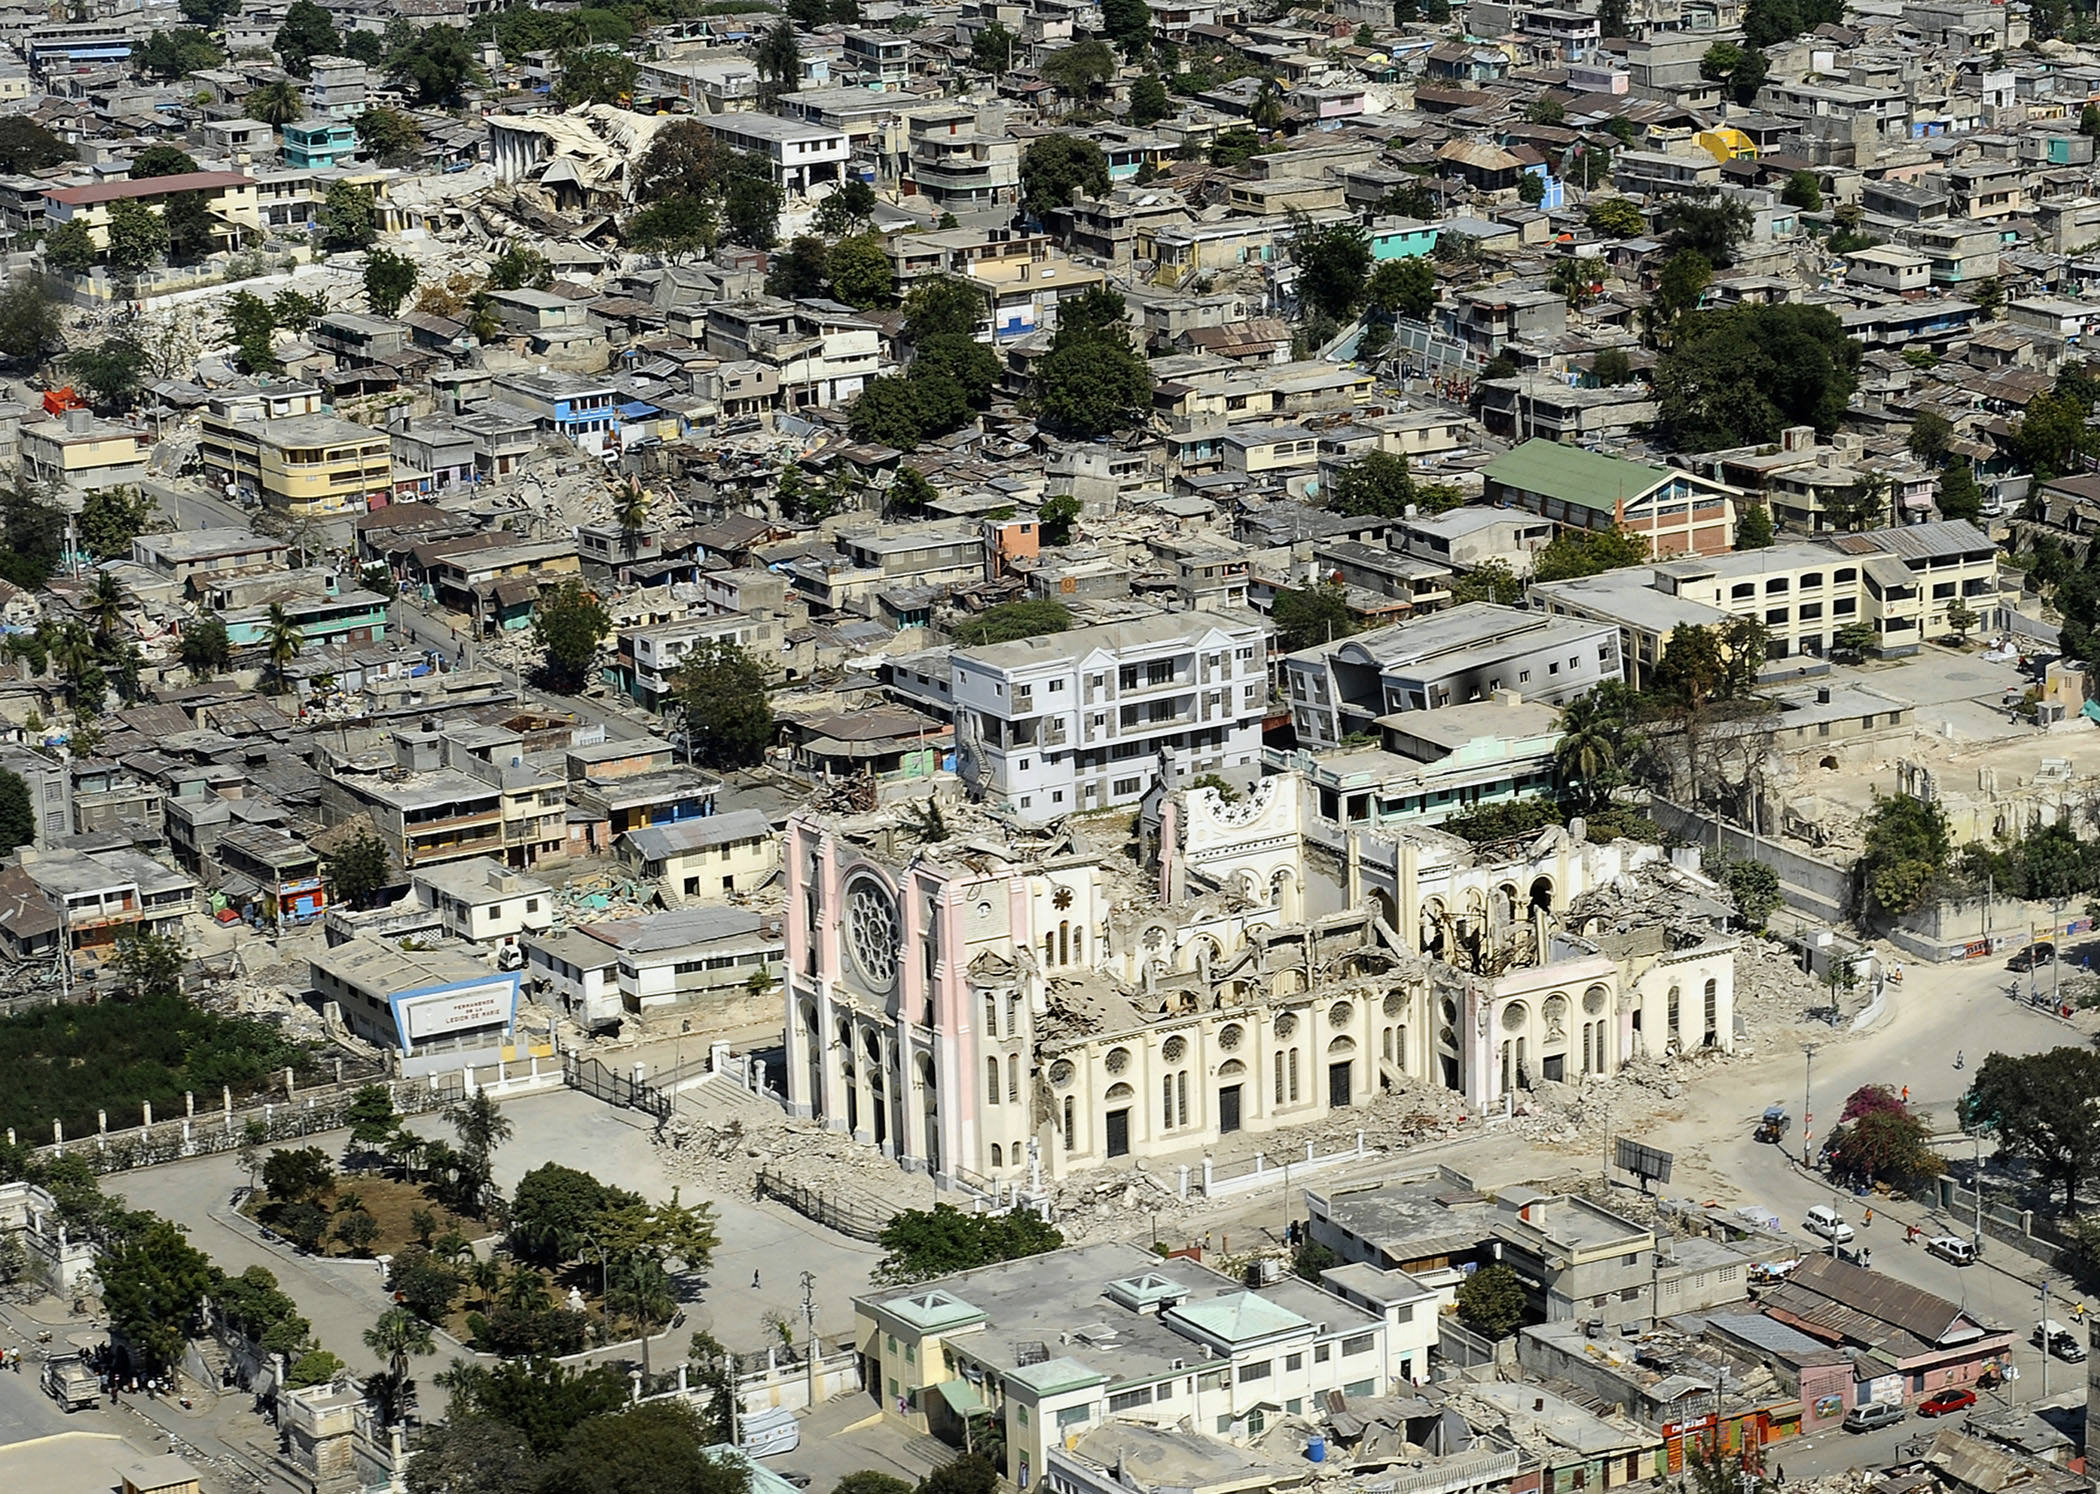
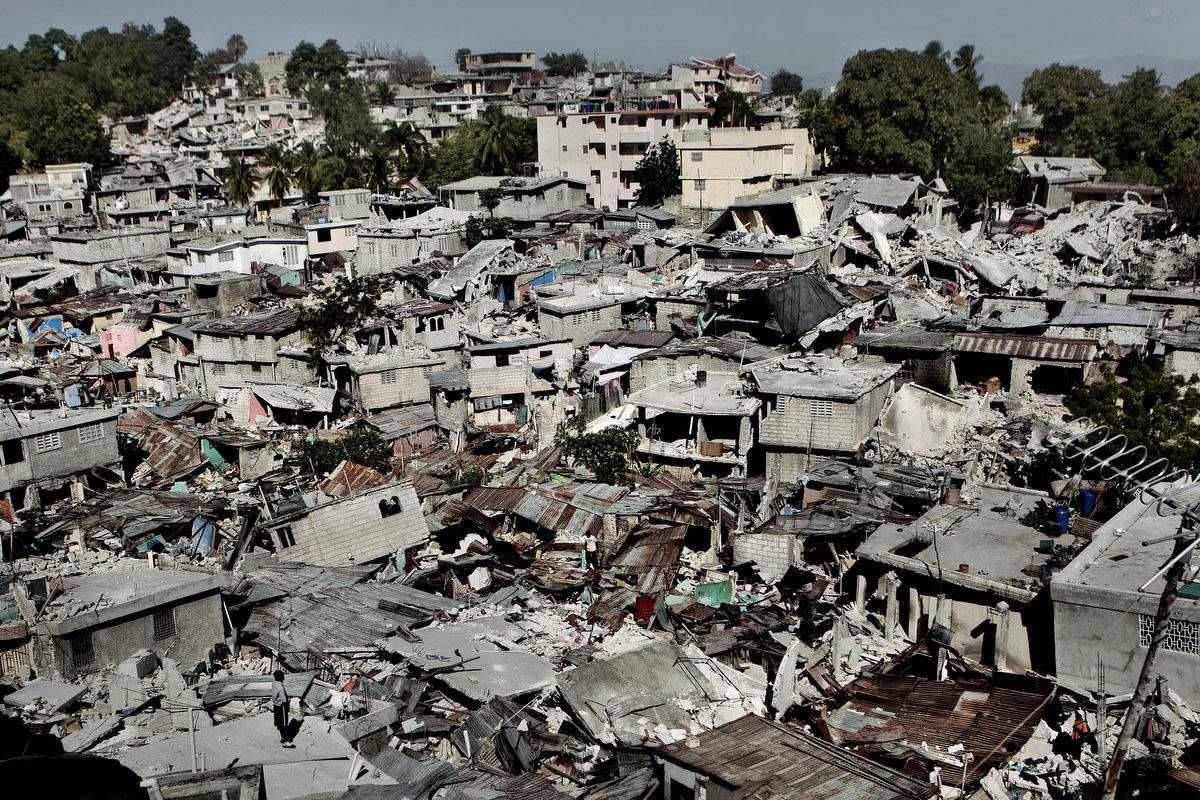
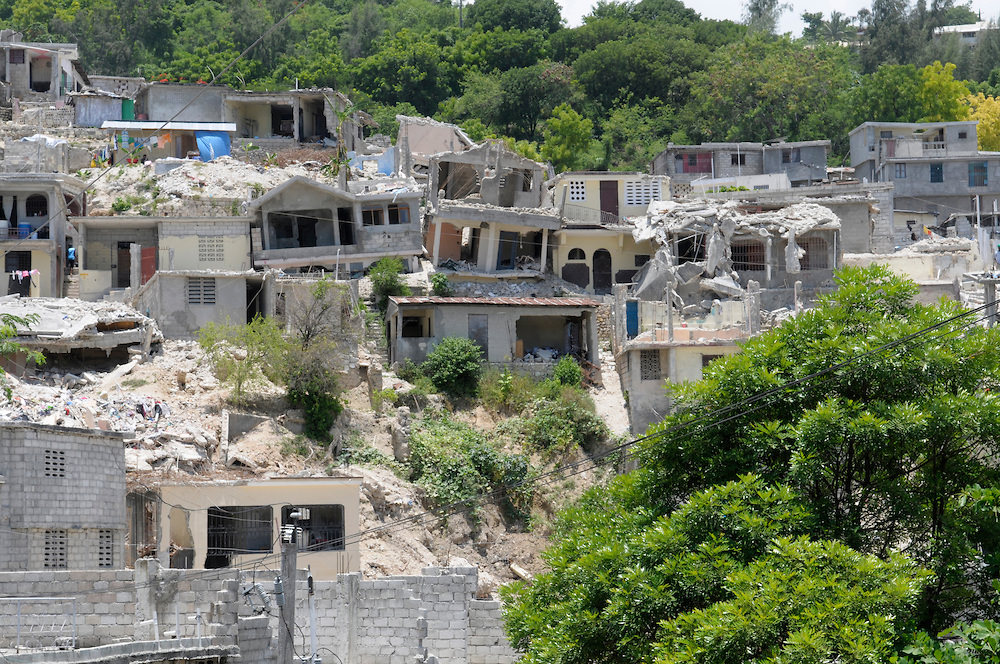
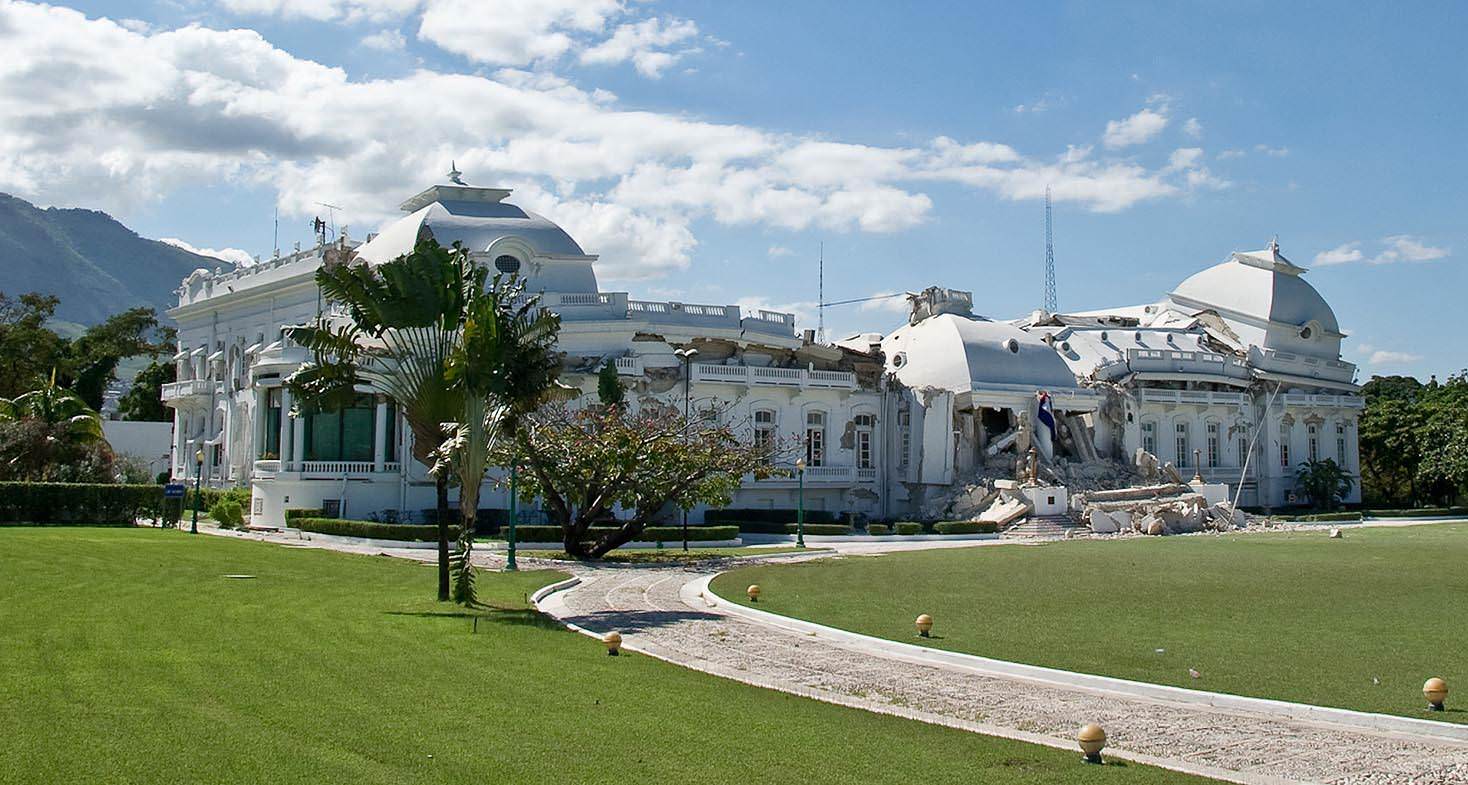
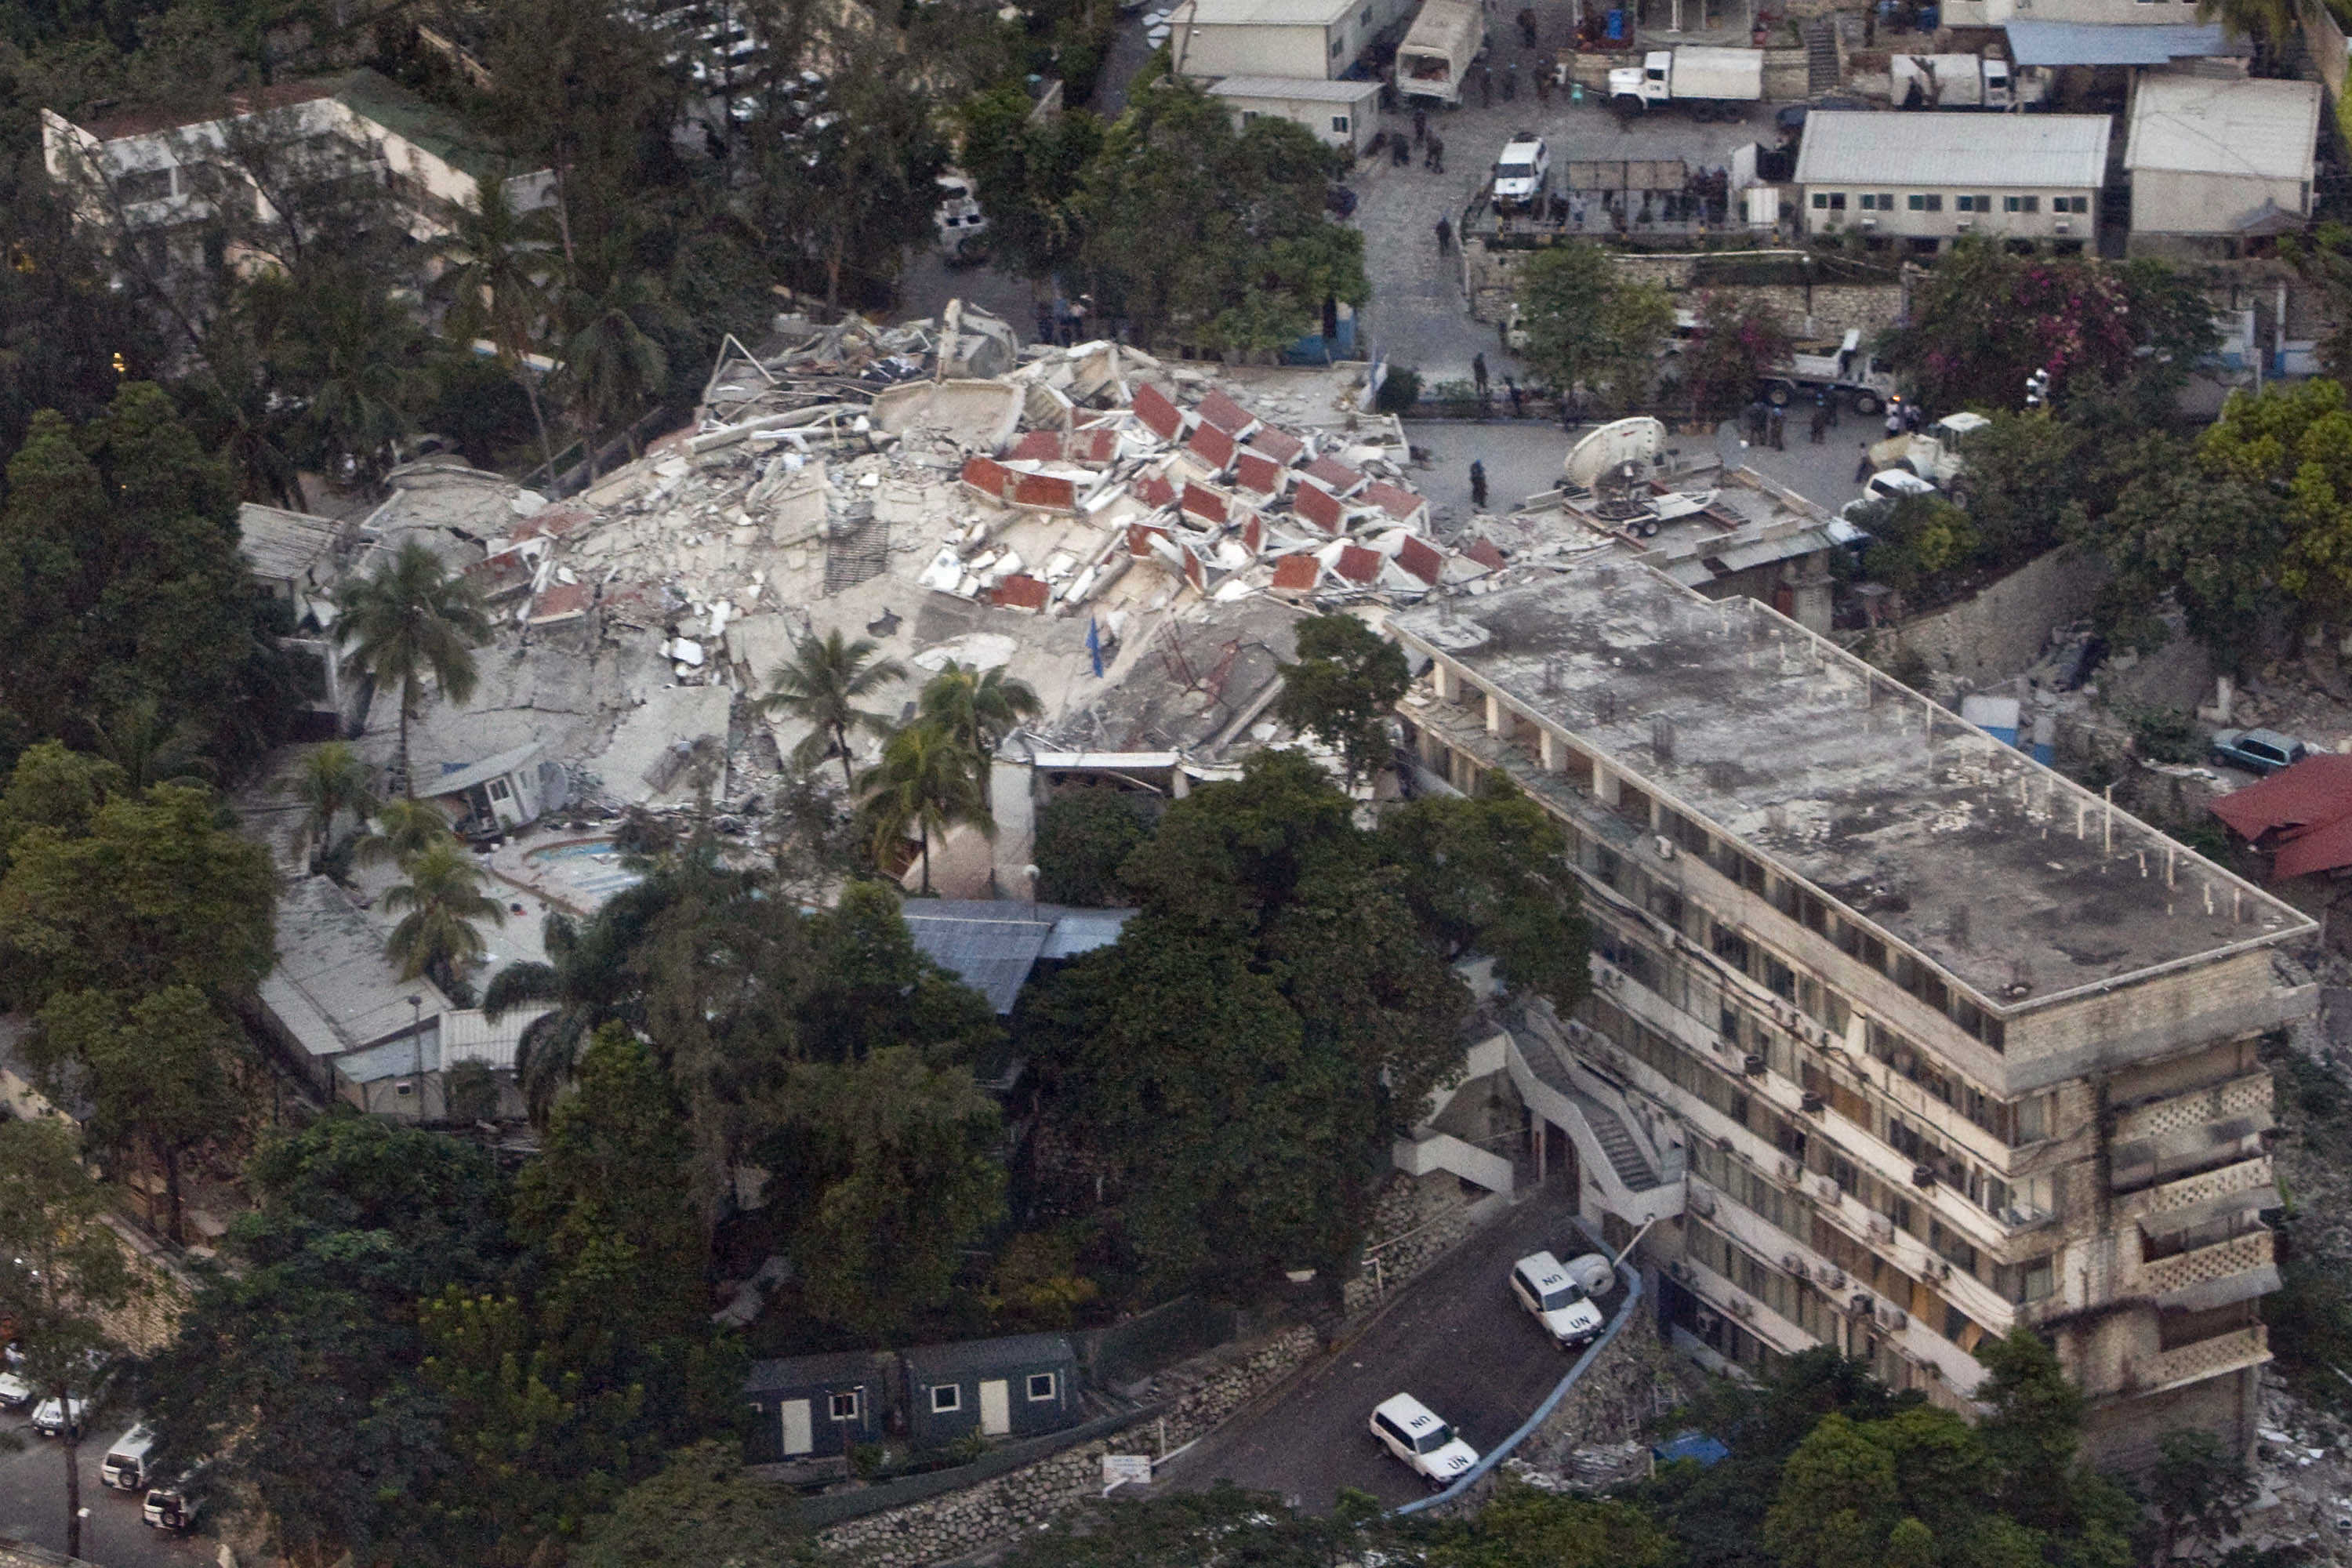
Port-au-Prince, Haiti 2010. On January 12, 2010, a magnitude 7.0 earthquake occurred with an epicenter approximately 25 km SW of Haiti’s capital, Port-au-Prince. Although the area’s seismic hazard had been known in scientific circles, it was almost completely overwhelmed in official and popular perceptions by the tropical cyclone hazard, with which Haiti contends on an almost annual basis. In the end, the earthquake killed a registered 222,570 people (EM-DAT, but really just an estimate), injured an estimated 300,000, and rendered initially homeless a reported million-plus people. Property and economic losses were estimated at $8.72 billon (in 2015 U.S. dollars). Part of these stunning losses was due to an urban population increase in and around Port-au-Prince from an estimated 800,000 people in the early 1980s to approximately 2.5 million at the time of the earthquake. Population density – 363 people per square kilometer in 2010 – was another aggravating factor. The other part of the explanation was an almost complete lack of both hazard-aware land use and building standards, particularly for the predominant cinder block and concrete homes, offices, and government buildings. To the extent that any hazard was considered, it was the tropical cyclone hazard, which doesn’t help much with earthquake resistance.

Compounding, and really explaining, this terrible combination of increased exposures with no real attempts at vulnerability reduction was the fact that Haiti was historically the weakest state in the Western Hemisphere. With a low number not a good sign, the Fragile States Index ranked Haiti #12 in the world in 2009 (it dropped to #10 in 2016). A reputation for corruption and a ranking near the bottom of the Human Development Index (#149 out of 182 countries), Haiti was in dire straits before the earthquake. Dubois (2012: 367) put the earthquake in a broader and deeper historical context:

The devastating 2010 earthquake profoundly deepened the country’s problems…. It also starkly exposed the Haitian state’s inability to help its people in times of crisis. A global response provided emergency assistance to the country in the days and weeks after the disaster, and an array of governments and organizations mobilized to try to contribute to rebuilding the country. But it is now also abundantly clear that the tremendous difficulties are part of much deeper and older problems: the aftershocks of a long history of internal conflicts and external pressures that has left Haiti’s population vulnerable and exposed.

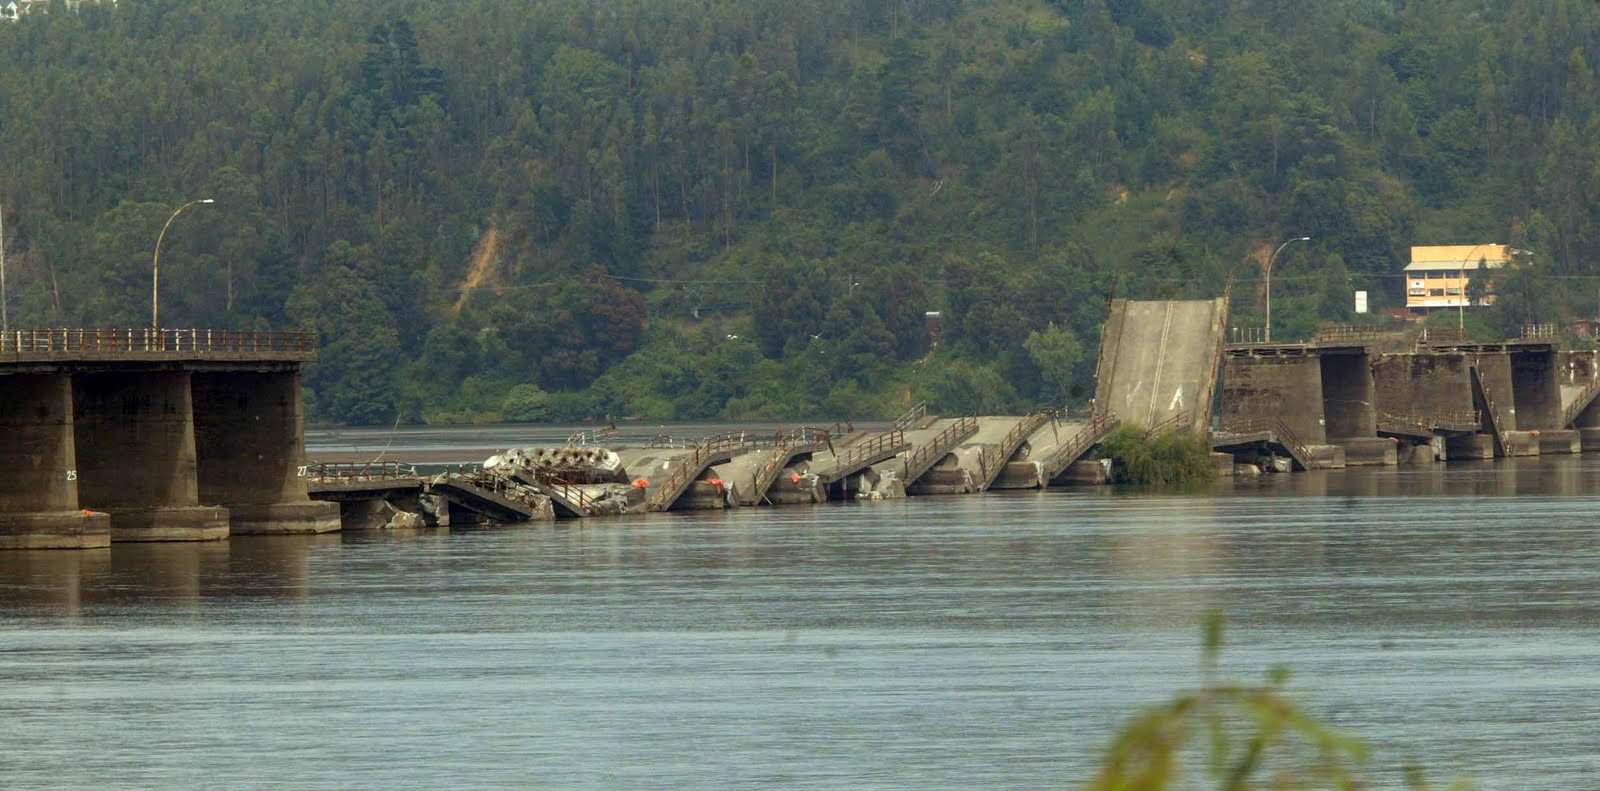
The 2010 Maule and Bio-Bio, Chile Earthquake. Chile, wedged between the Pacific Ocean and the Andes mountains, is a long (2,700 miles) and narrow (109 miles wide on average) country that sits just above where the Nazca tectonic plate is subducting under the South America plate and is one of the most seismically active areas in the world.

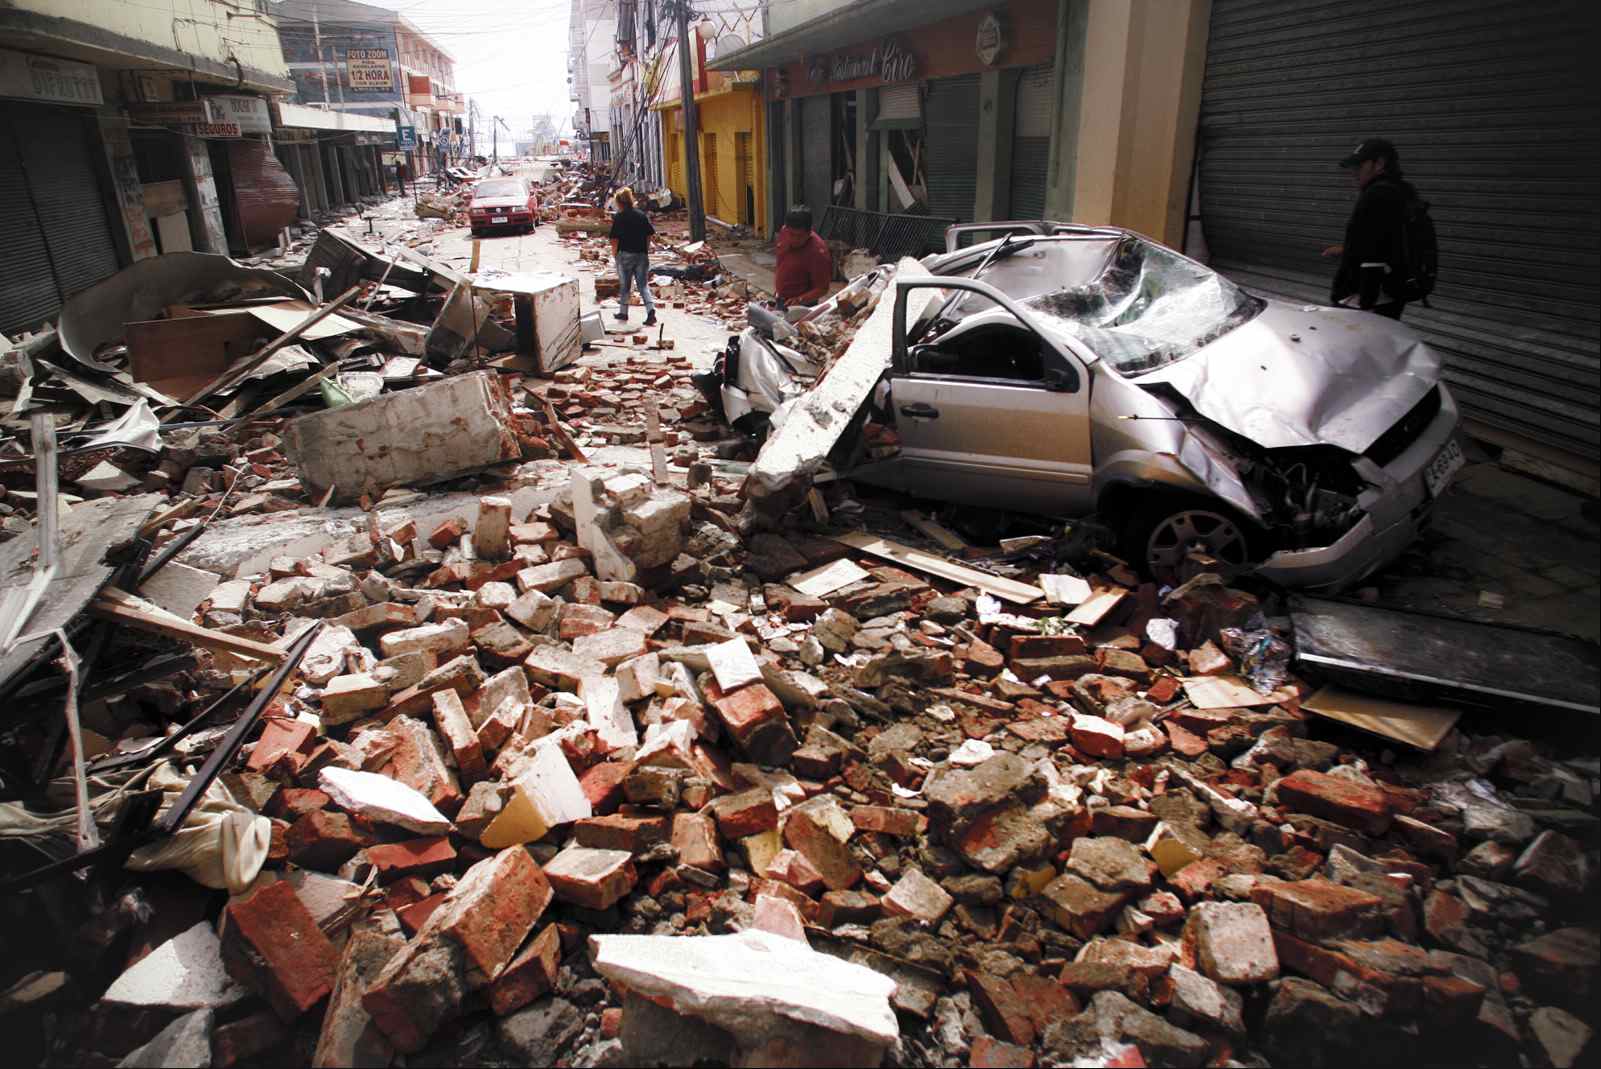
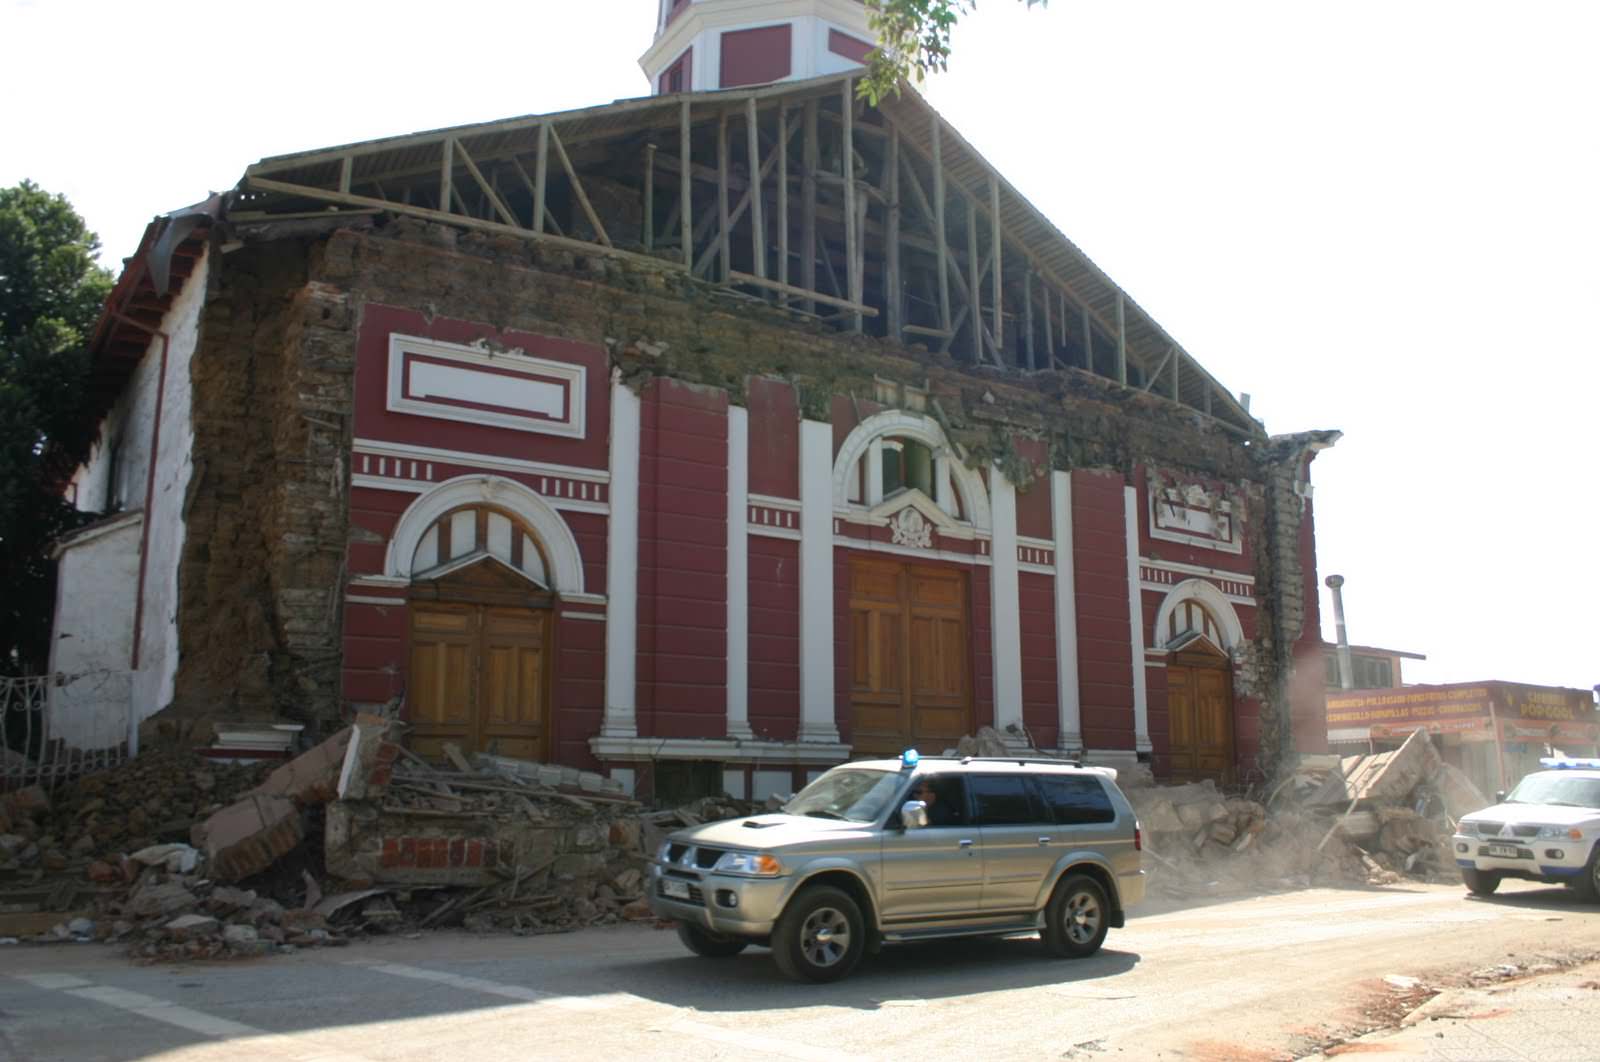
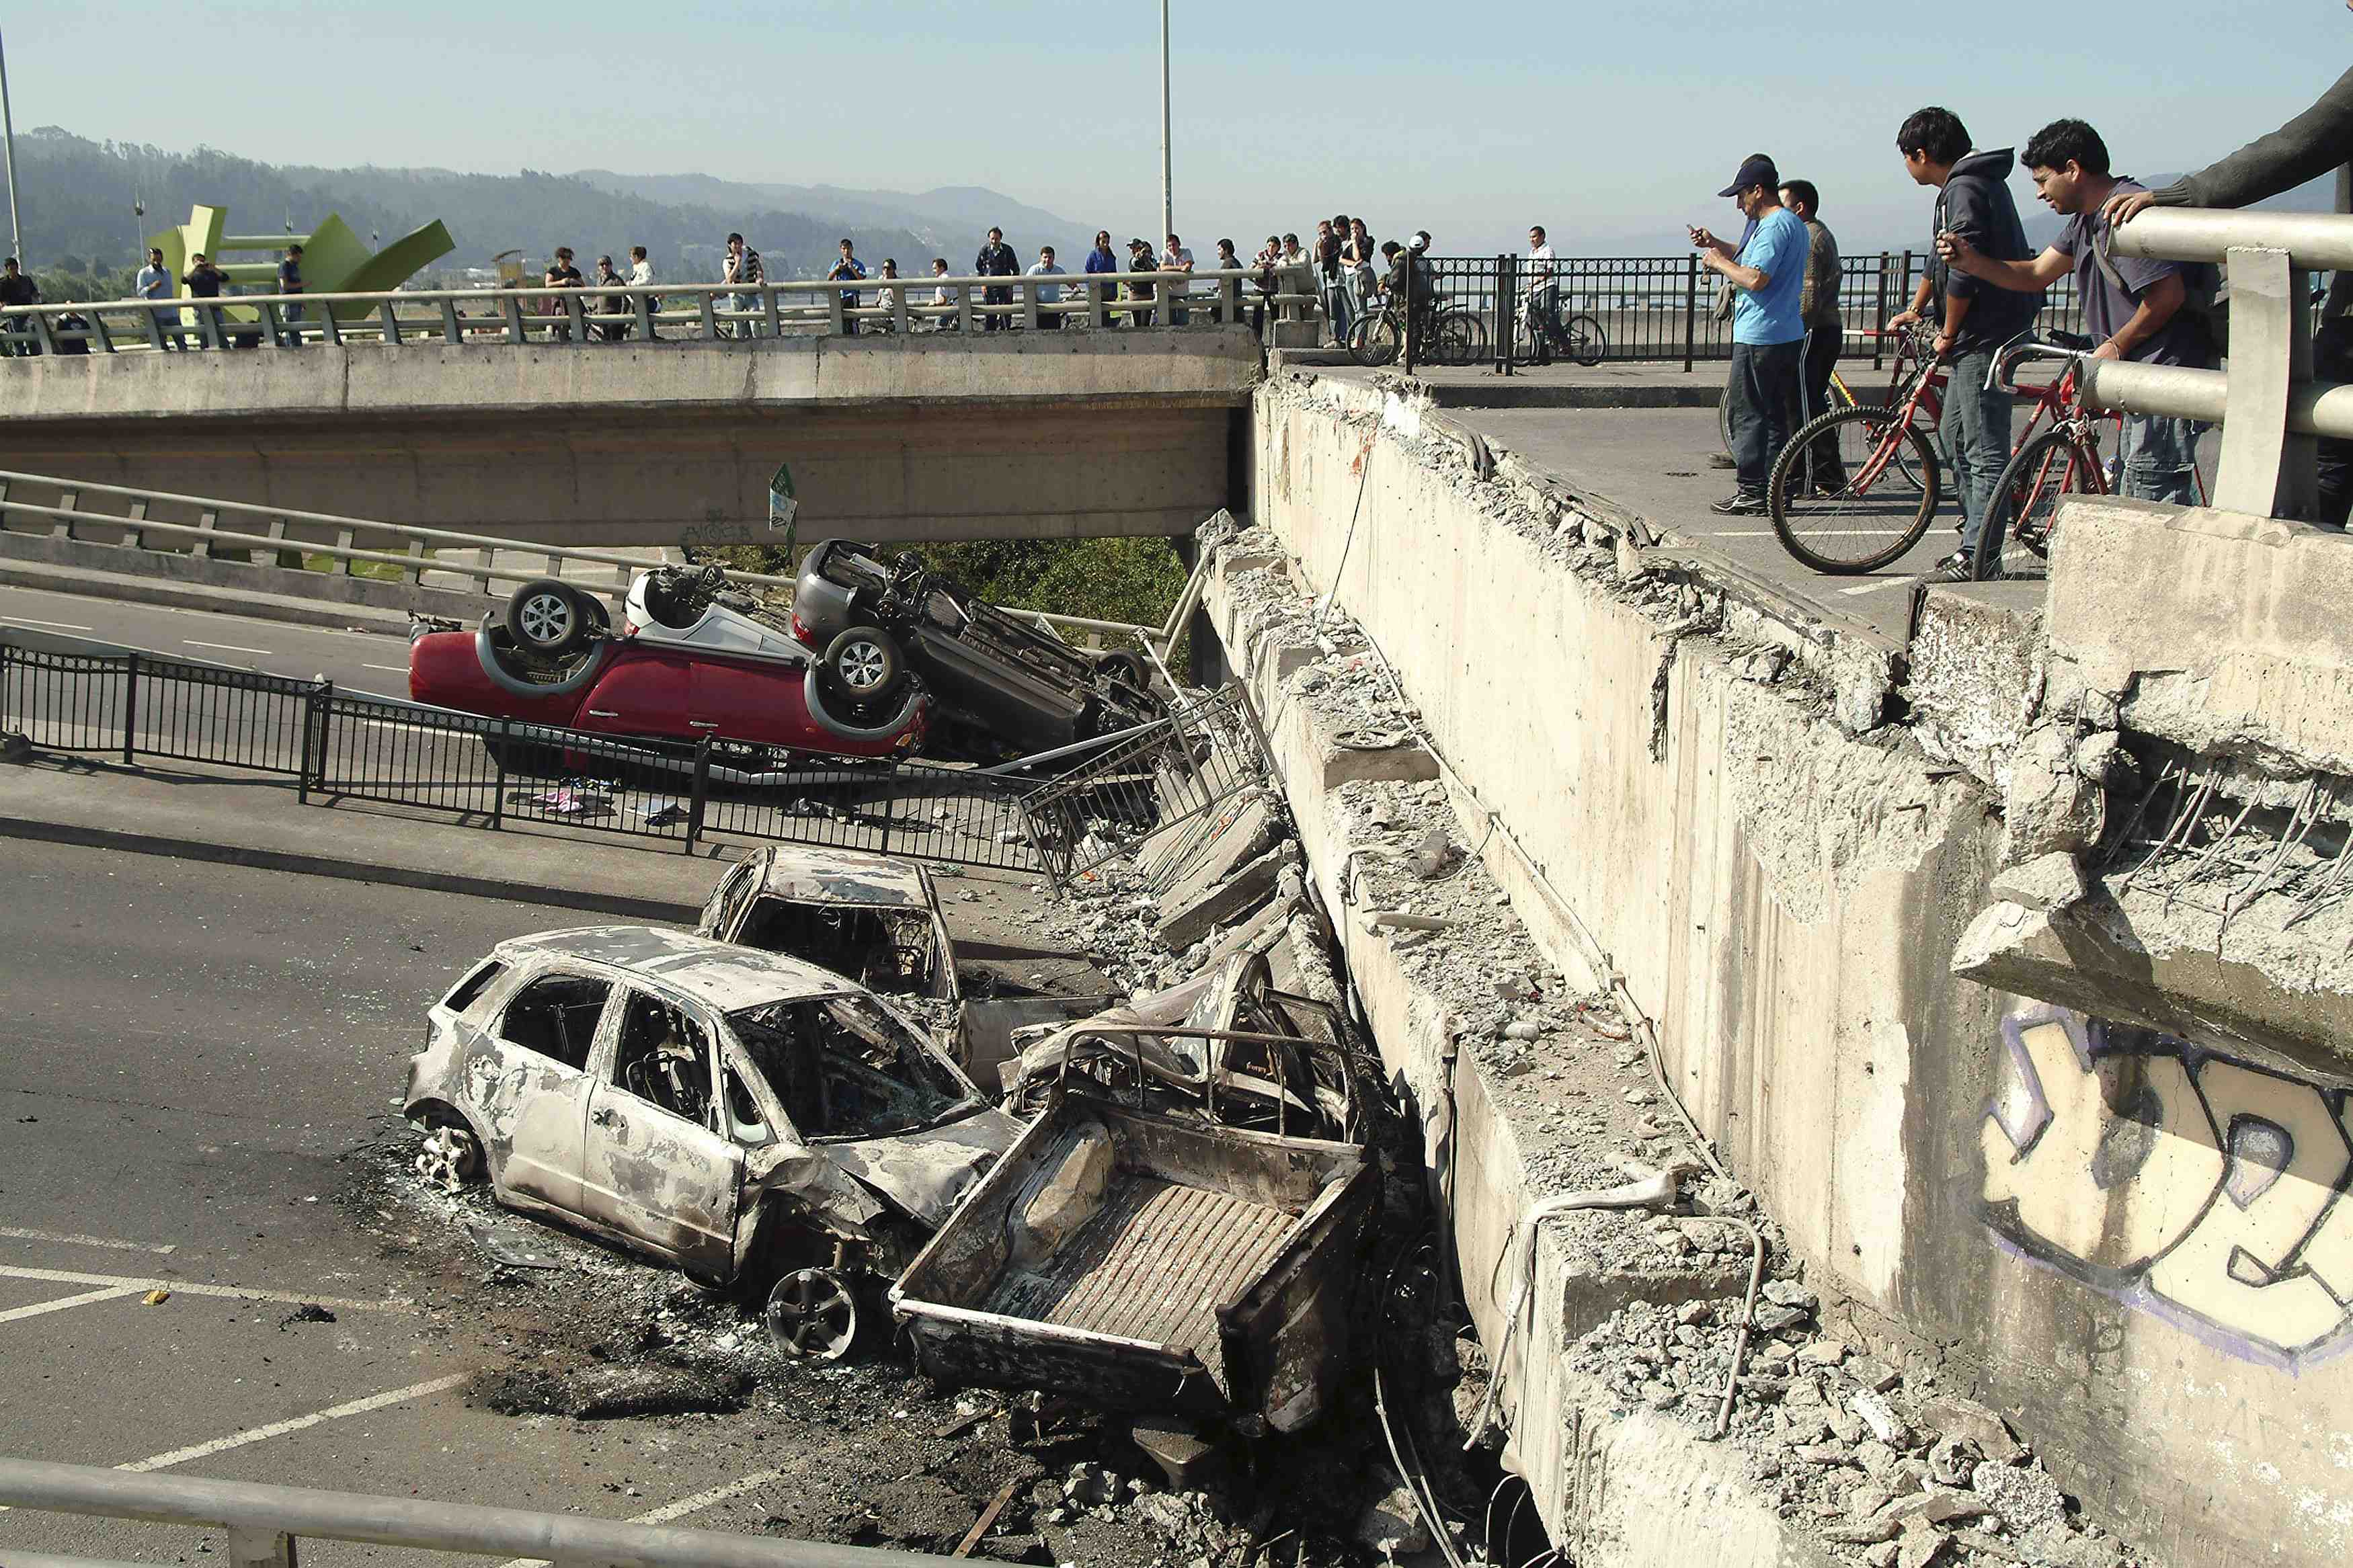
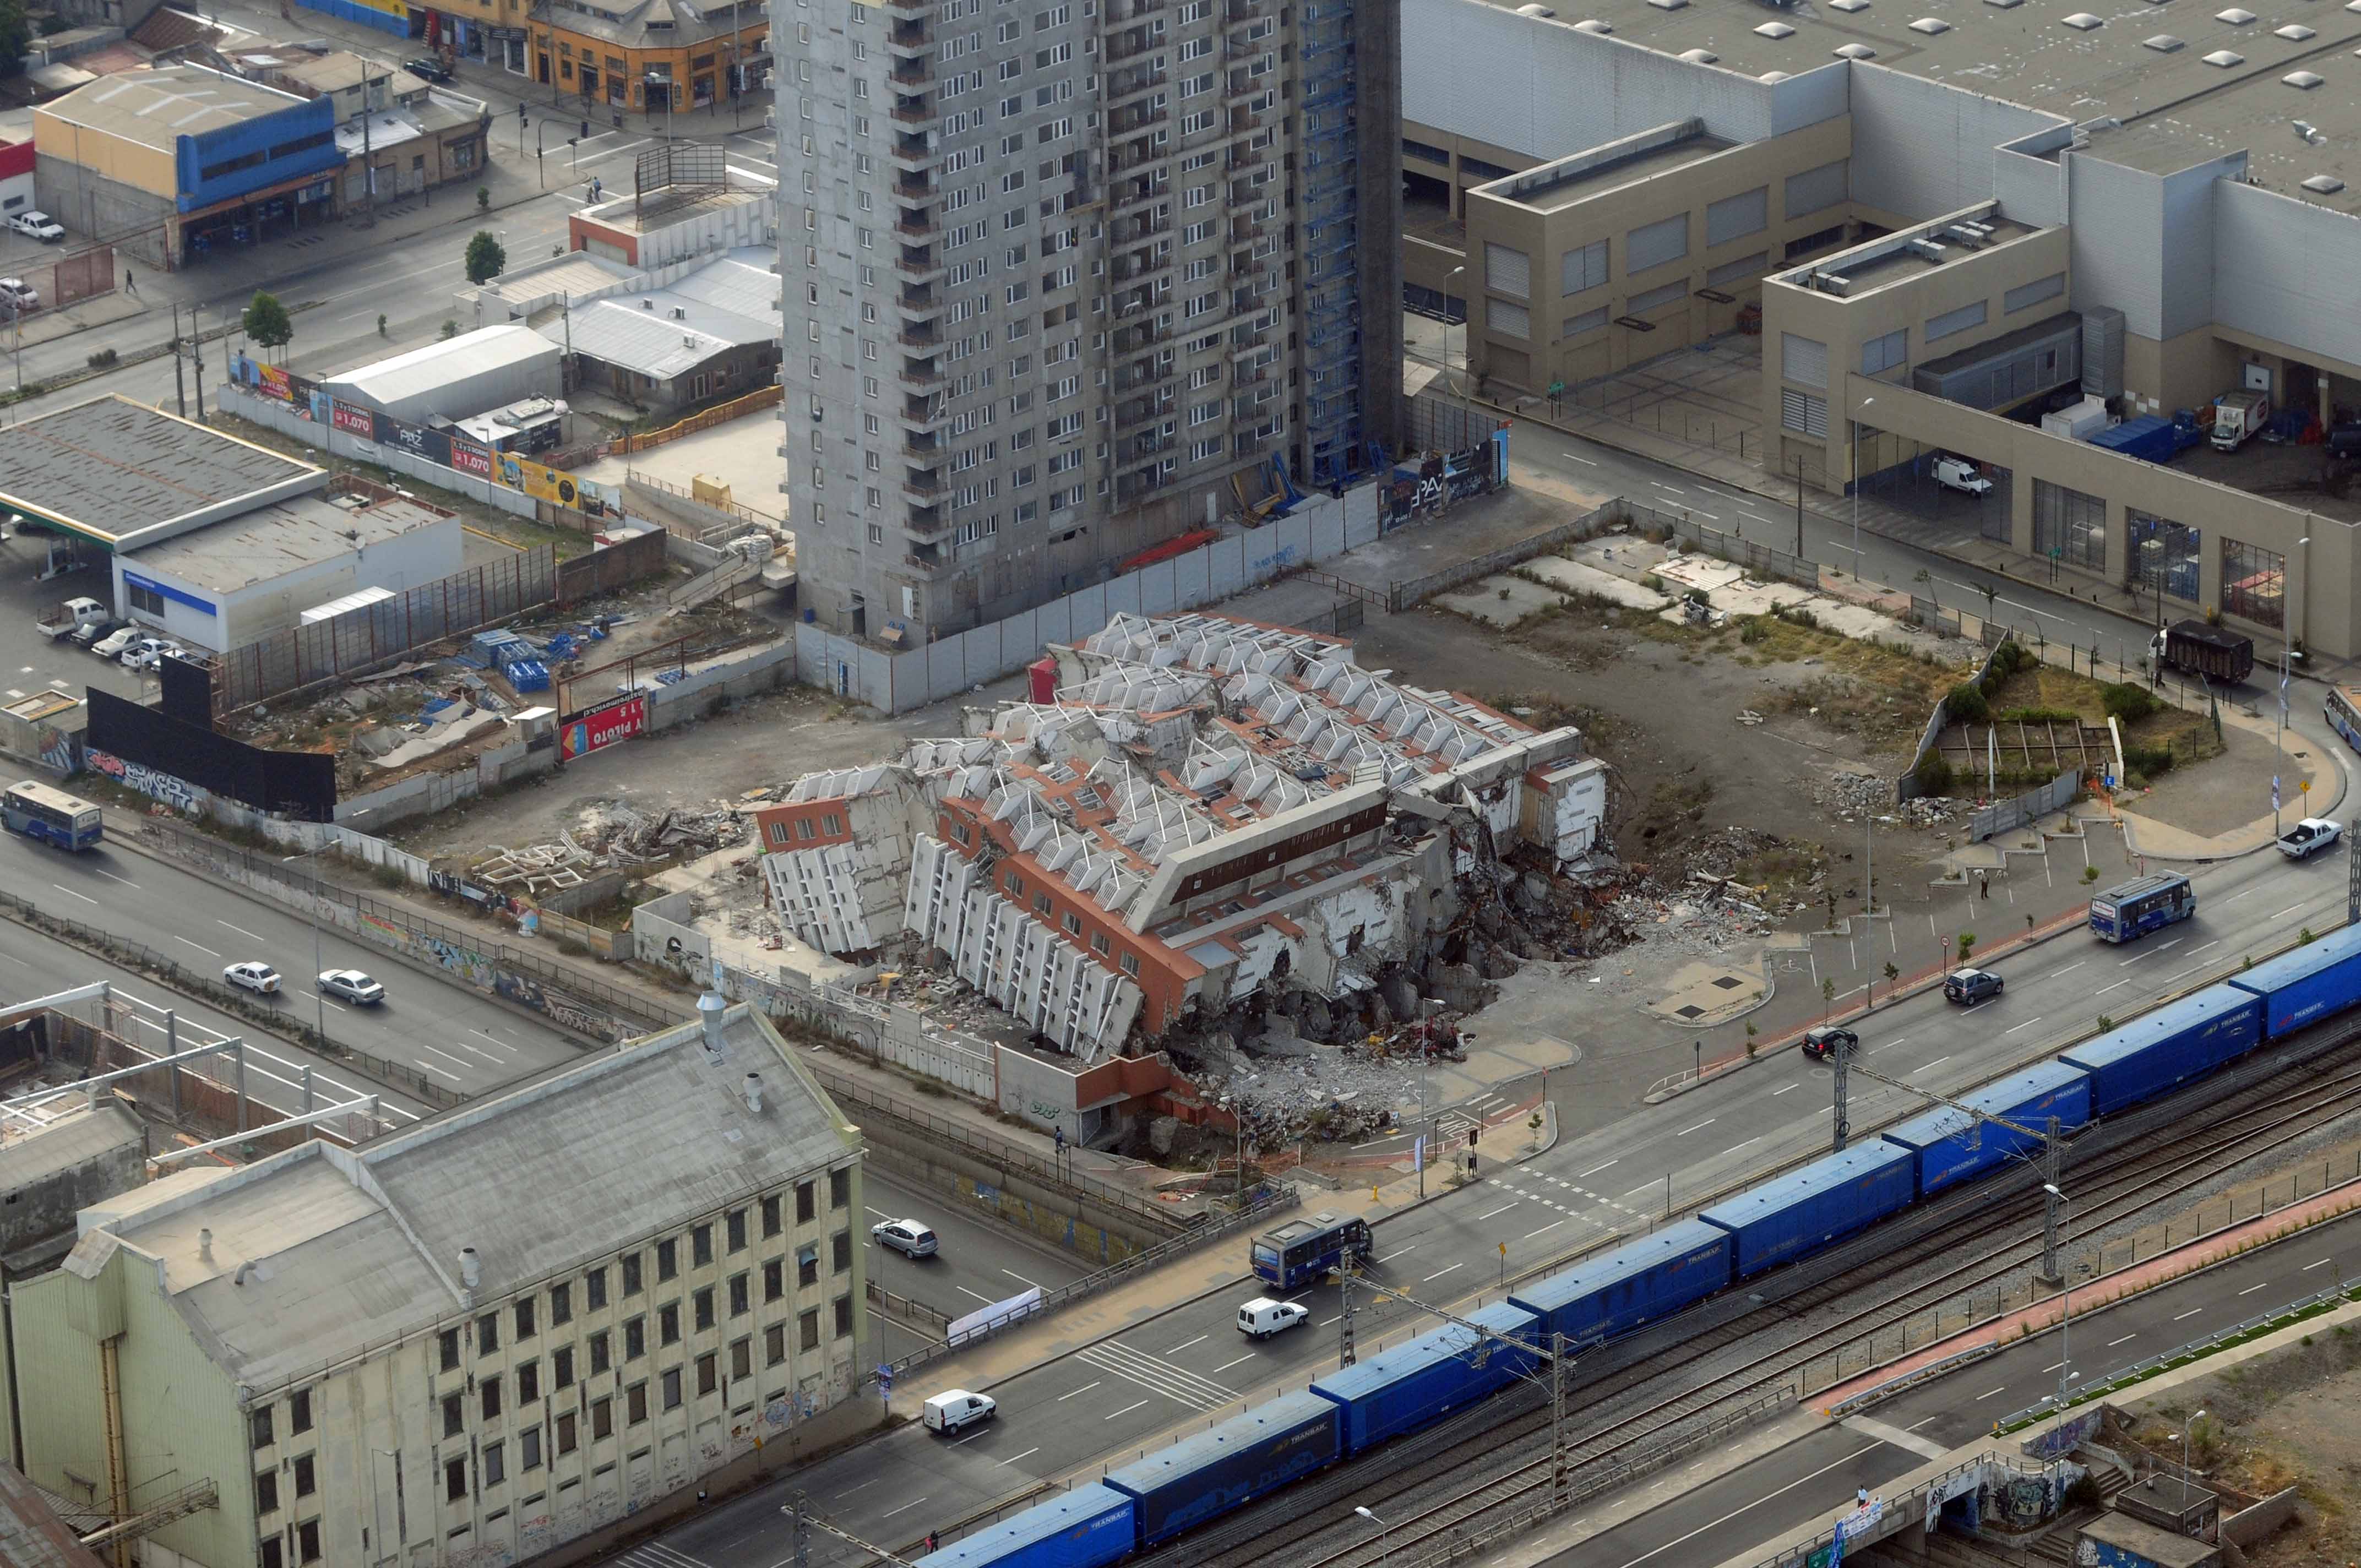
On February 27, 2010, a magnitude 8.8 earthquake struck the Maule and Bio-Bio regions of Chile. According to EM-DAT, the Chile earthquake and tsunami killed 562 people, caused $32.7 billion (in 2015 U.S. dollars) in total damage, and affected 2,671,556 people.

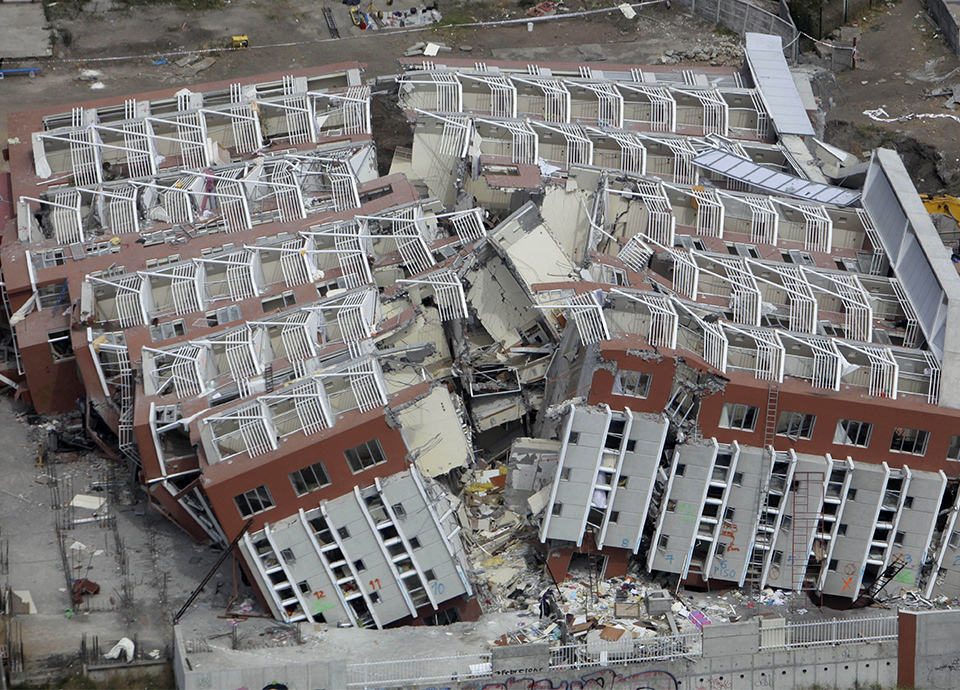
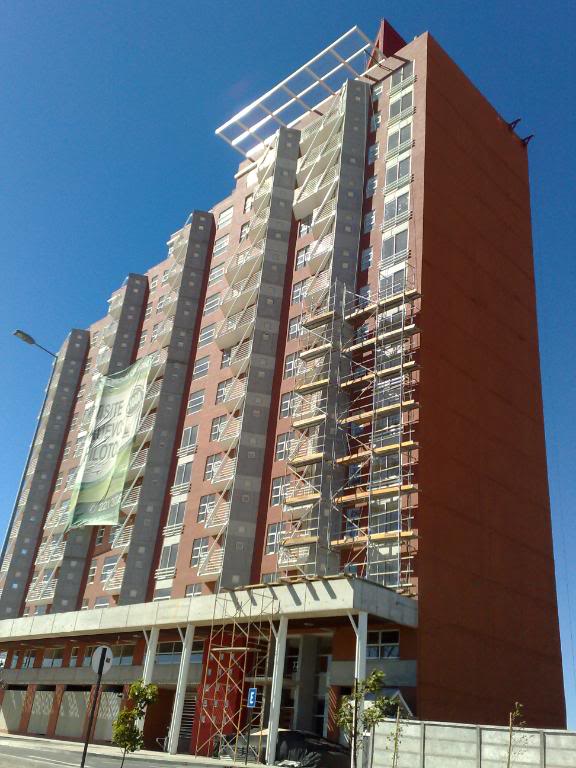
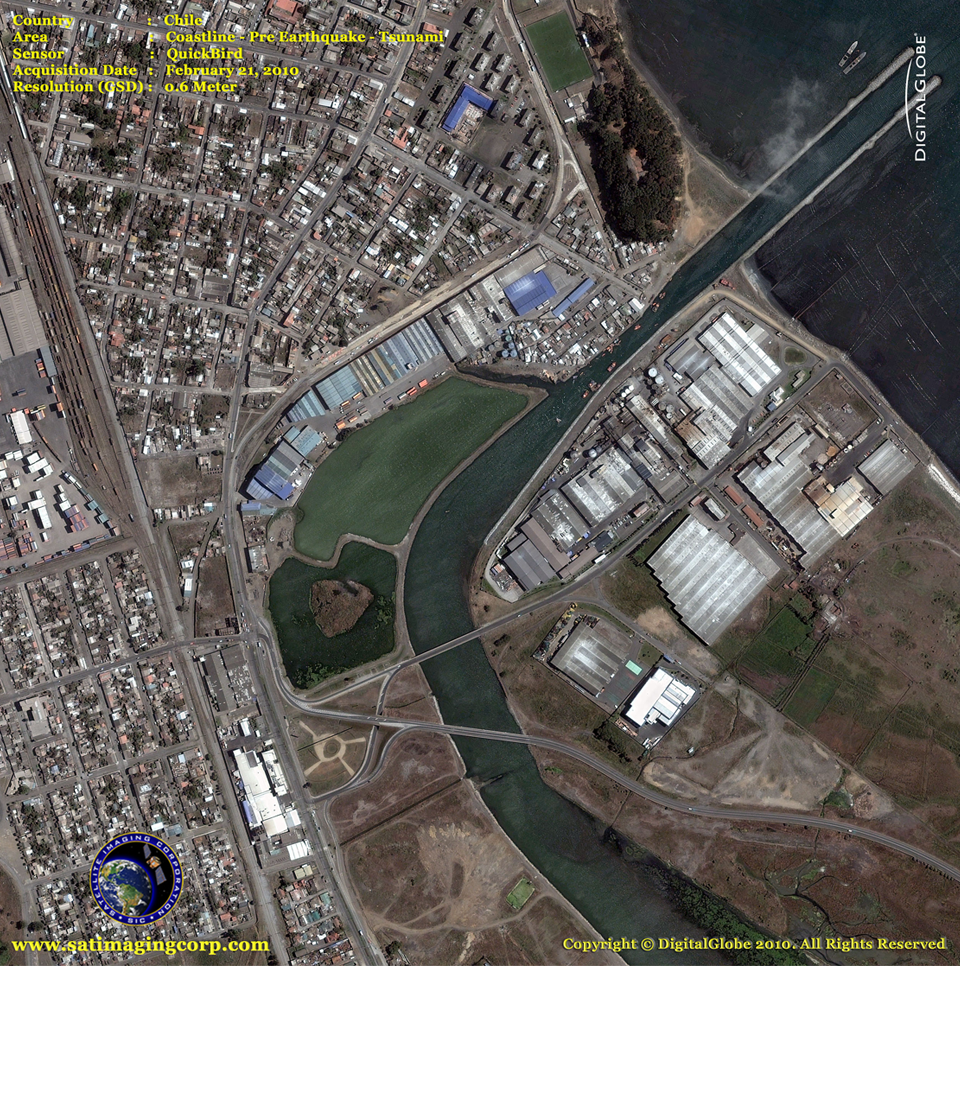
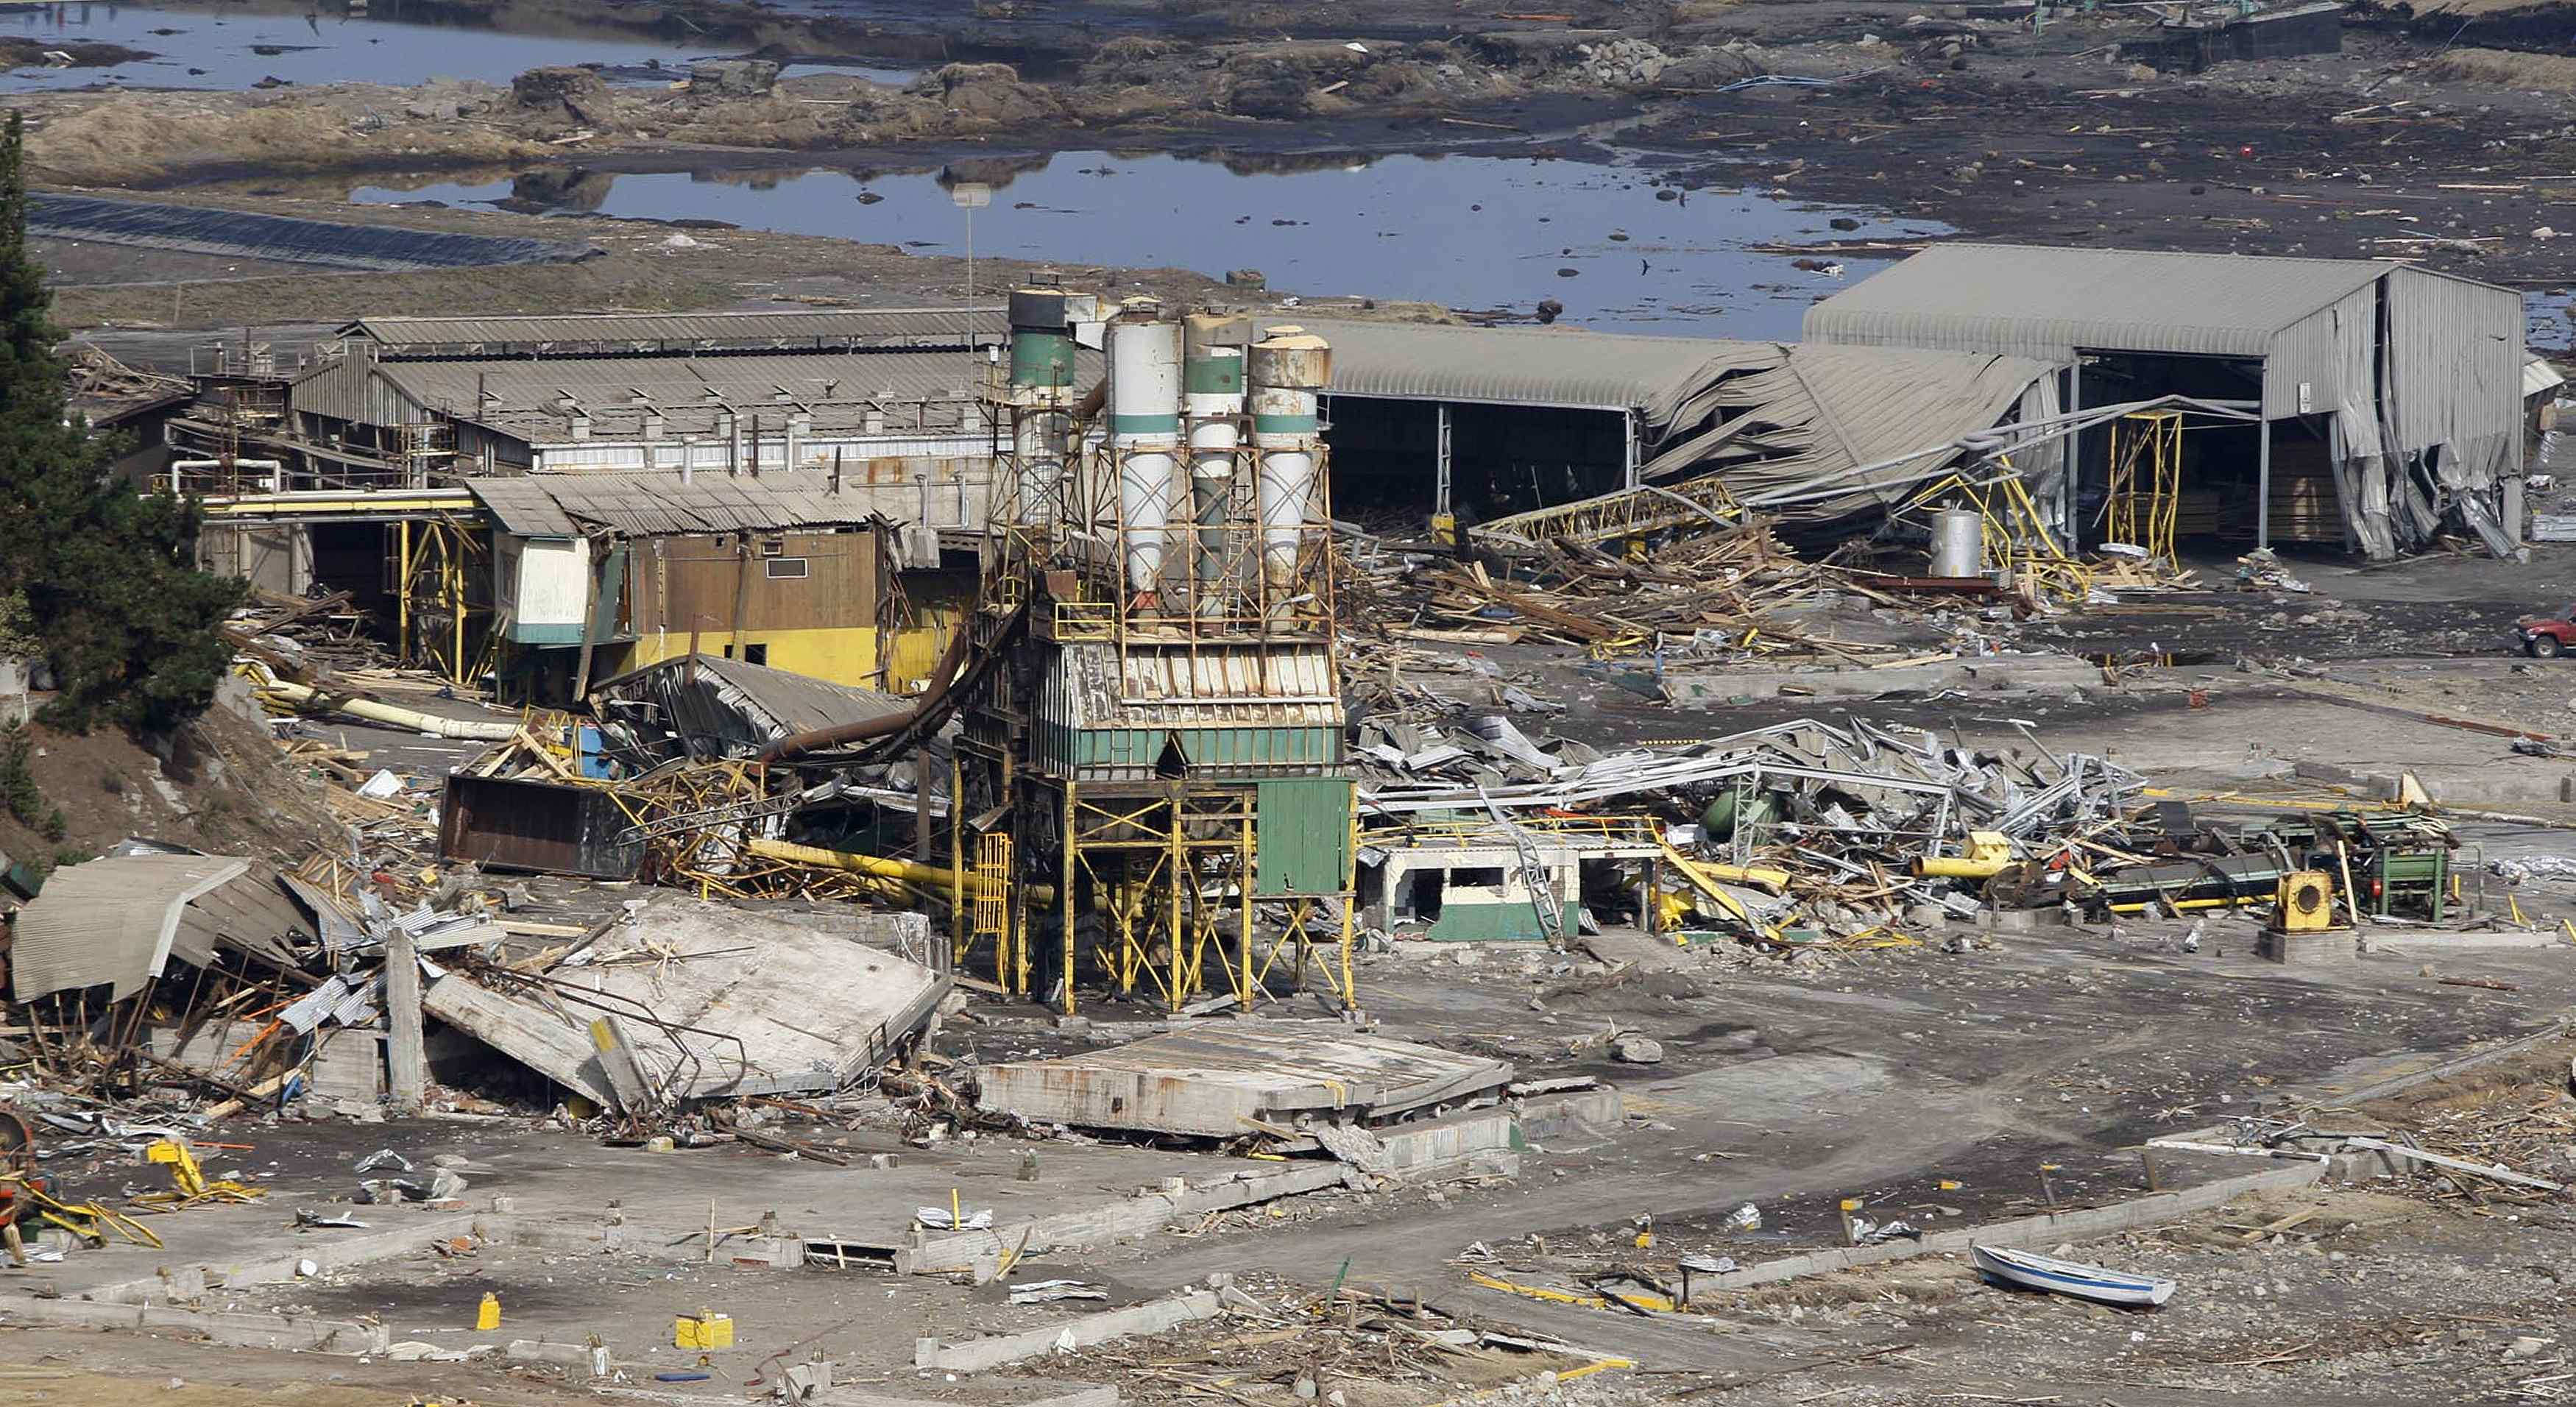
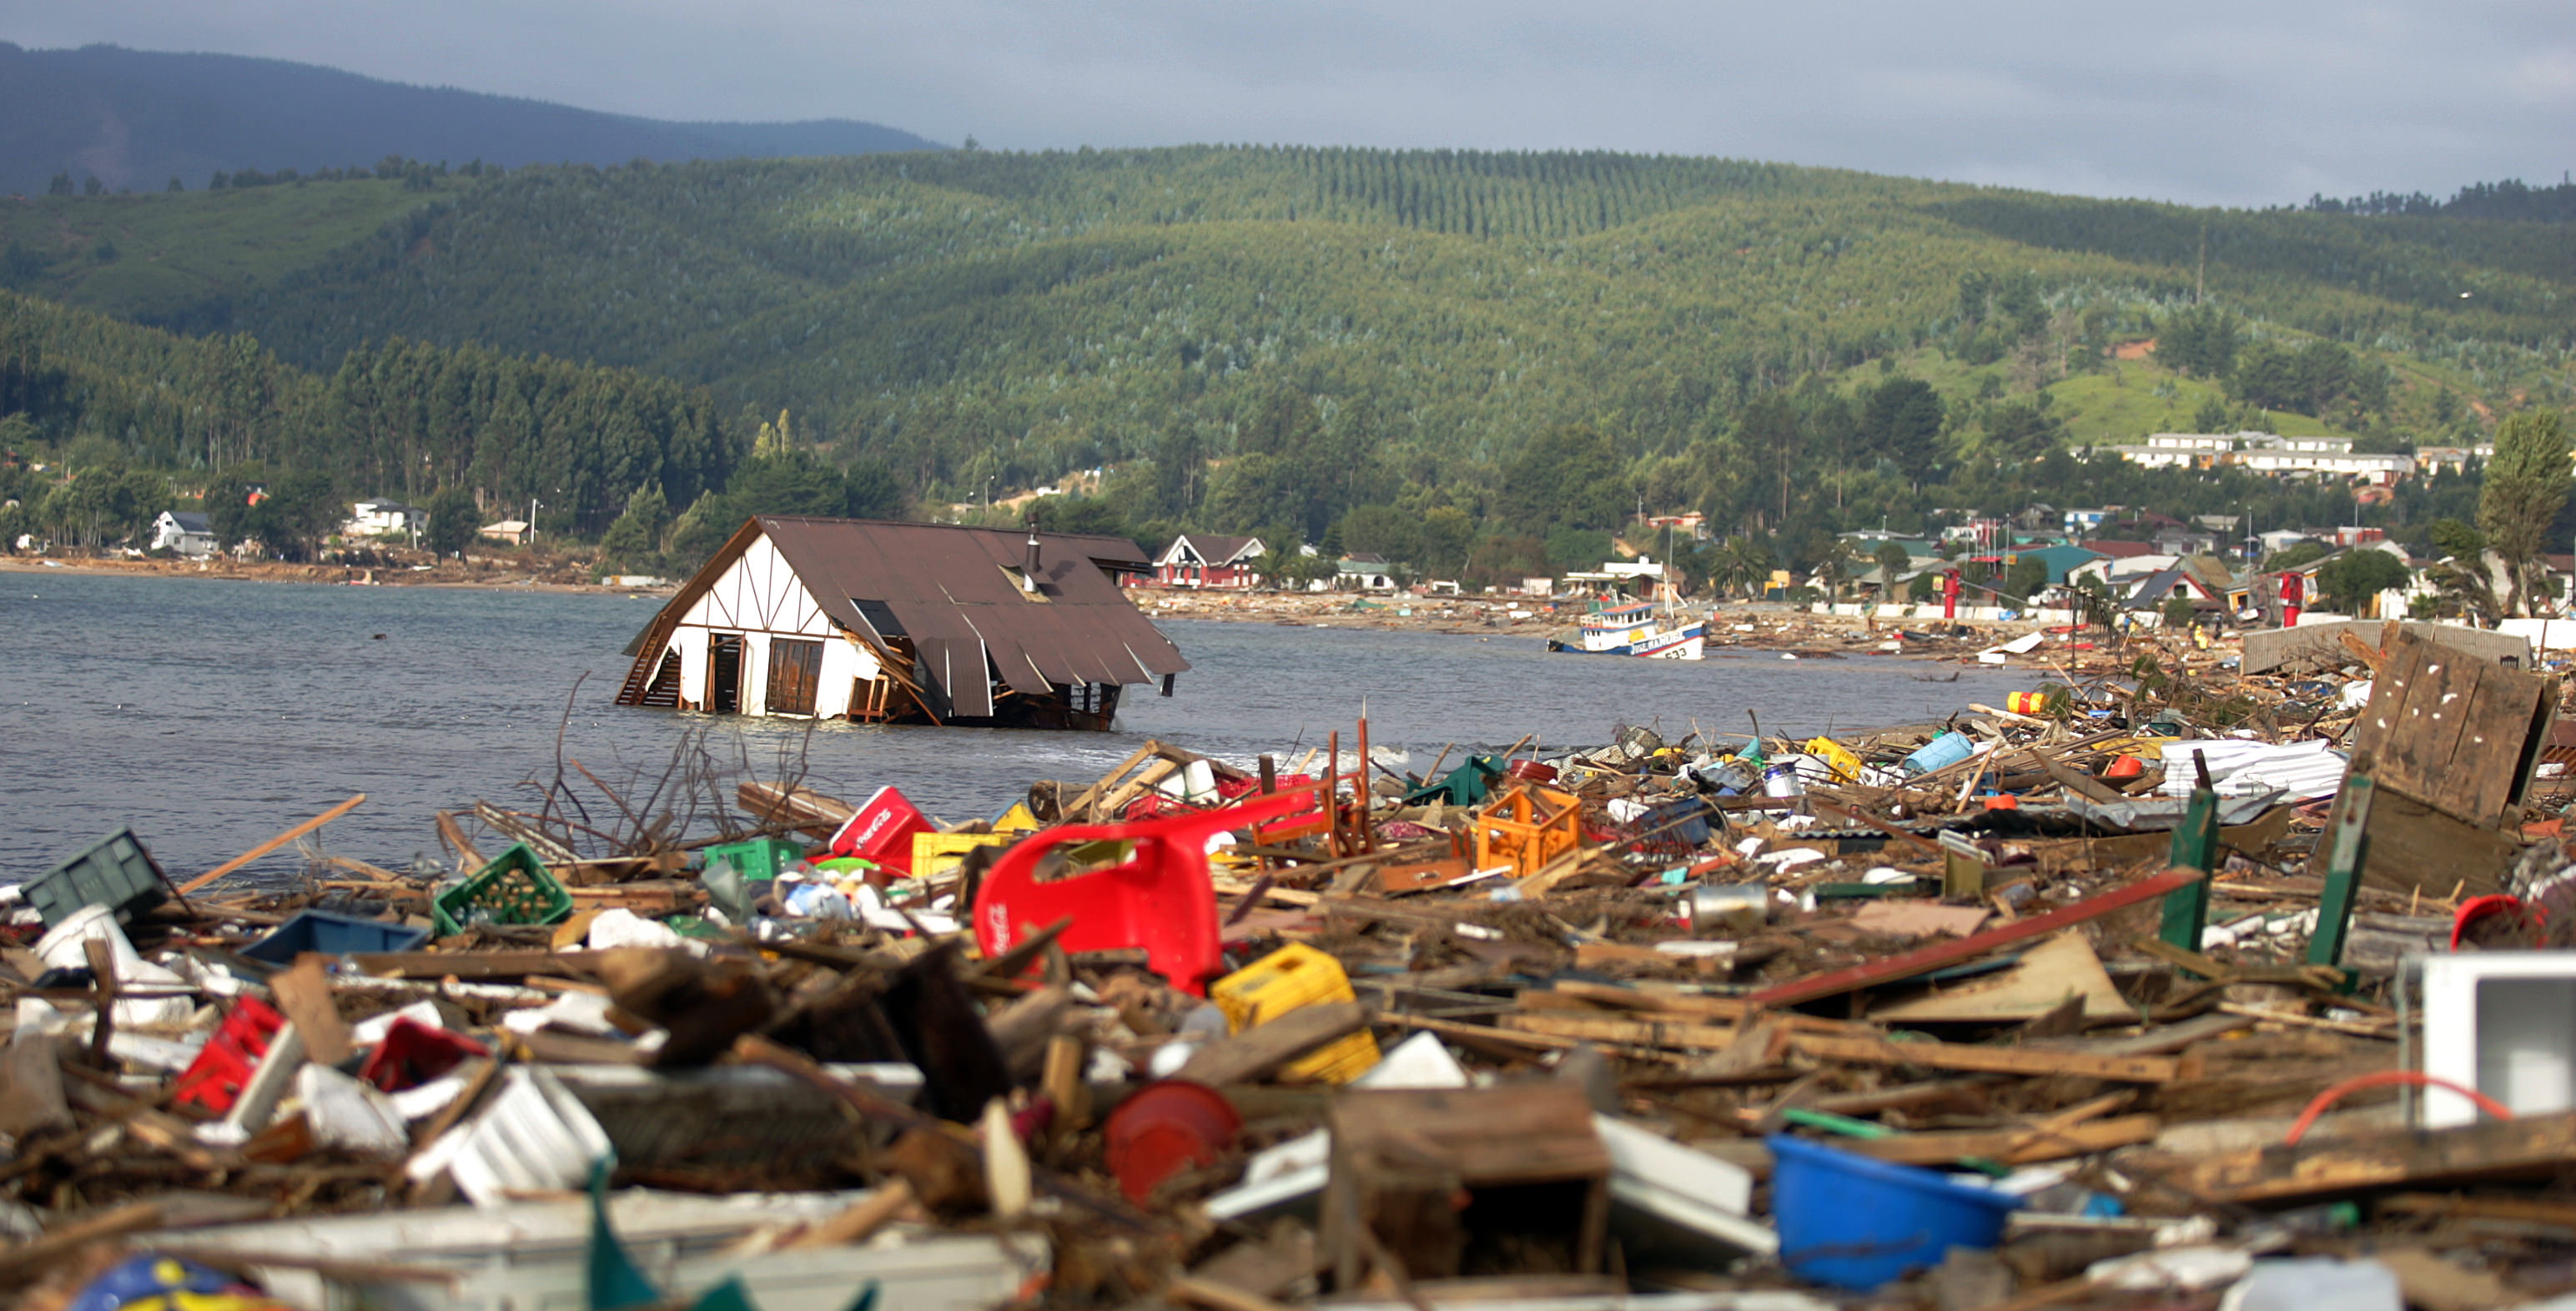
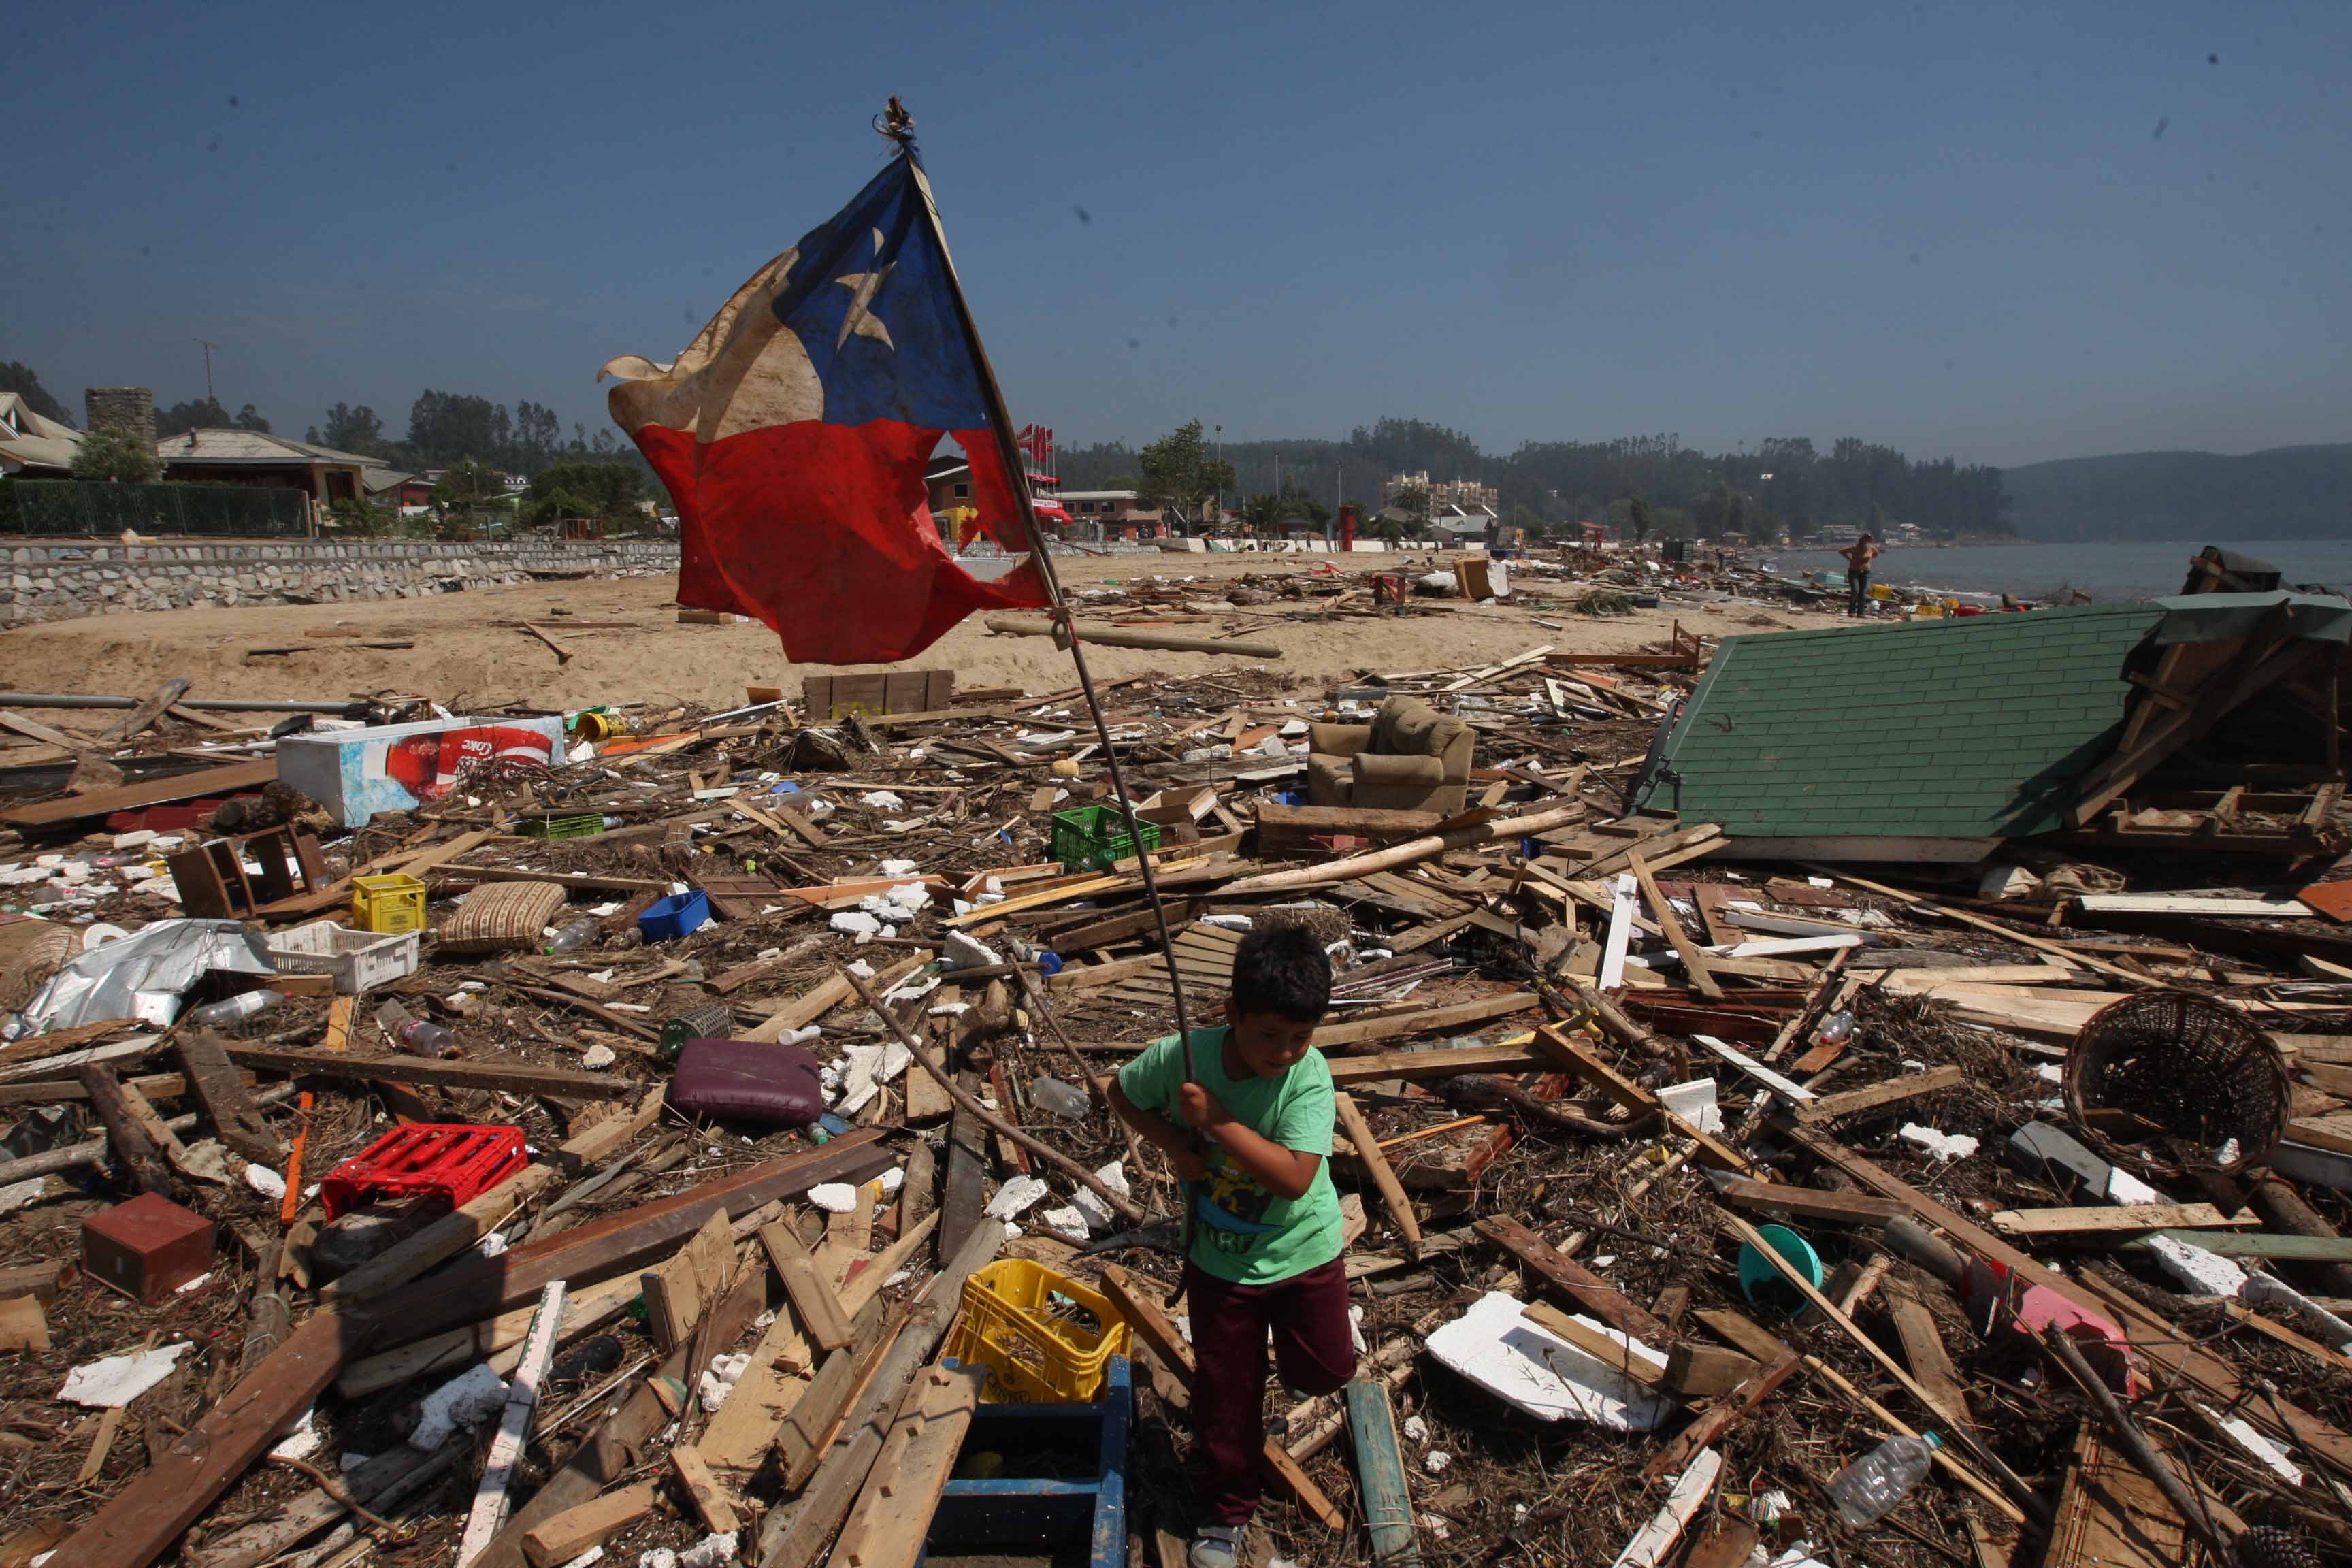
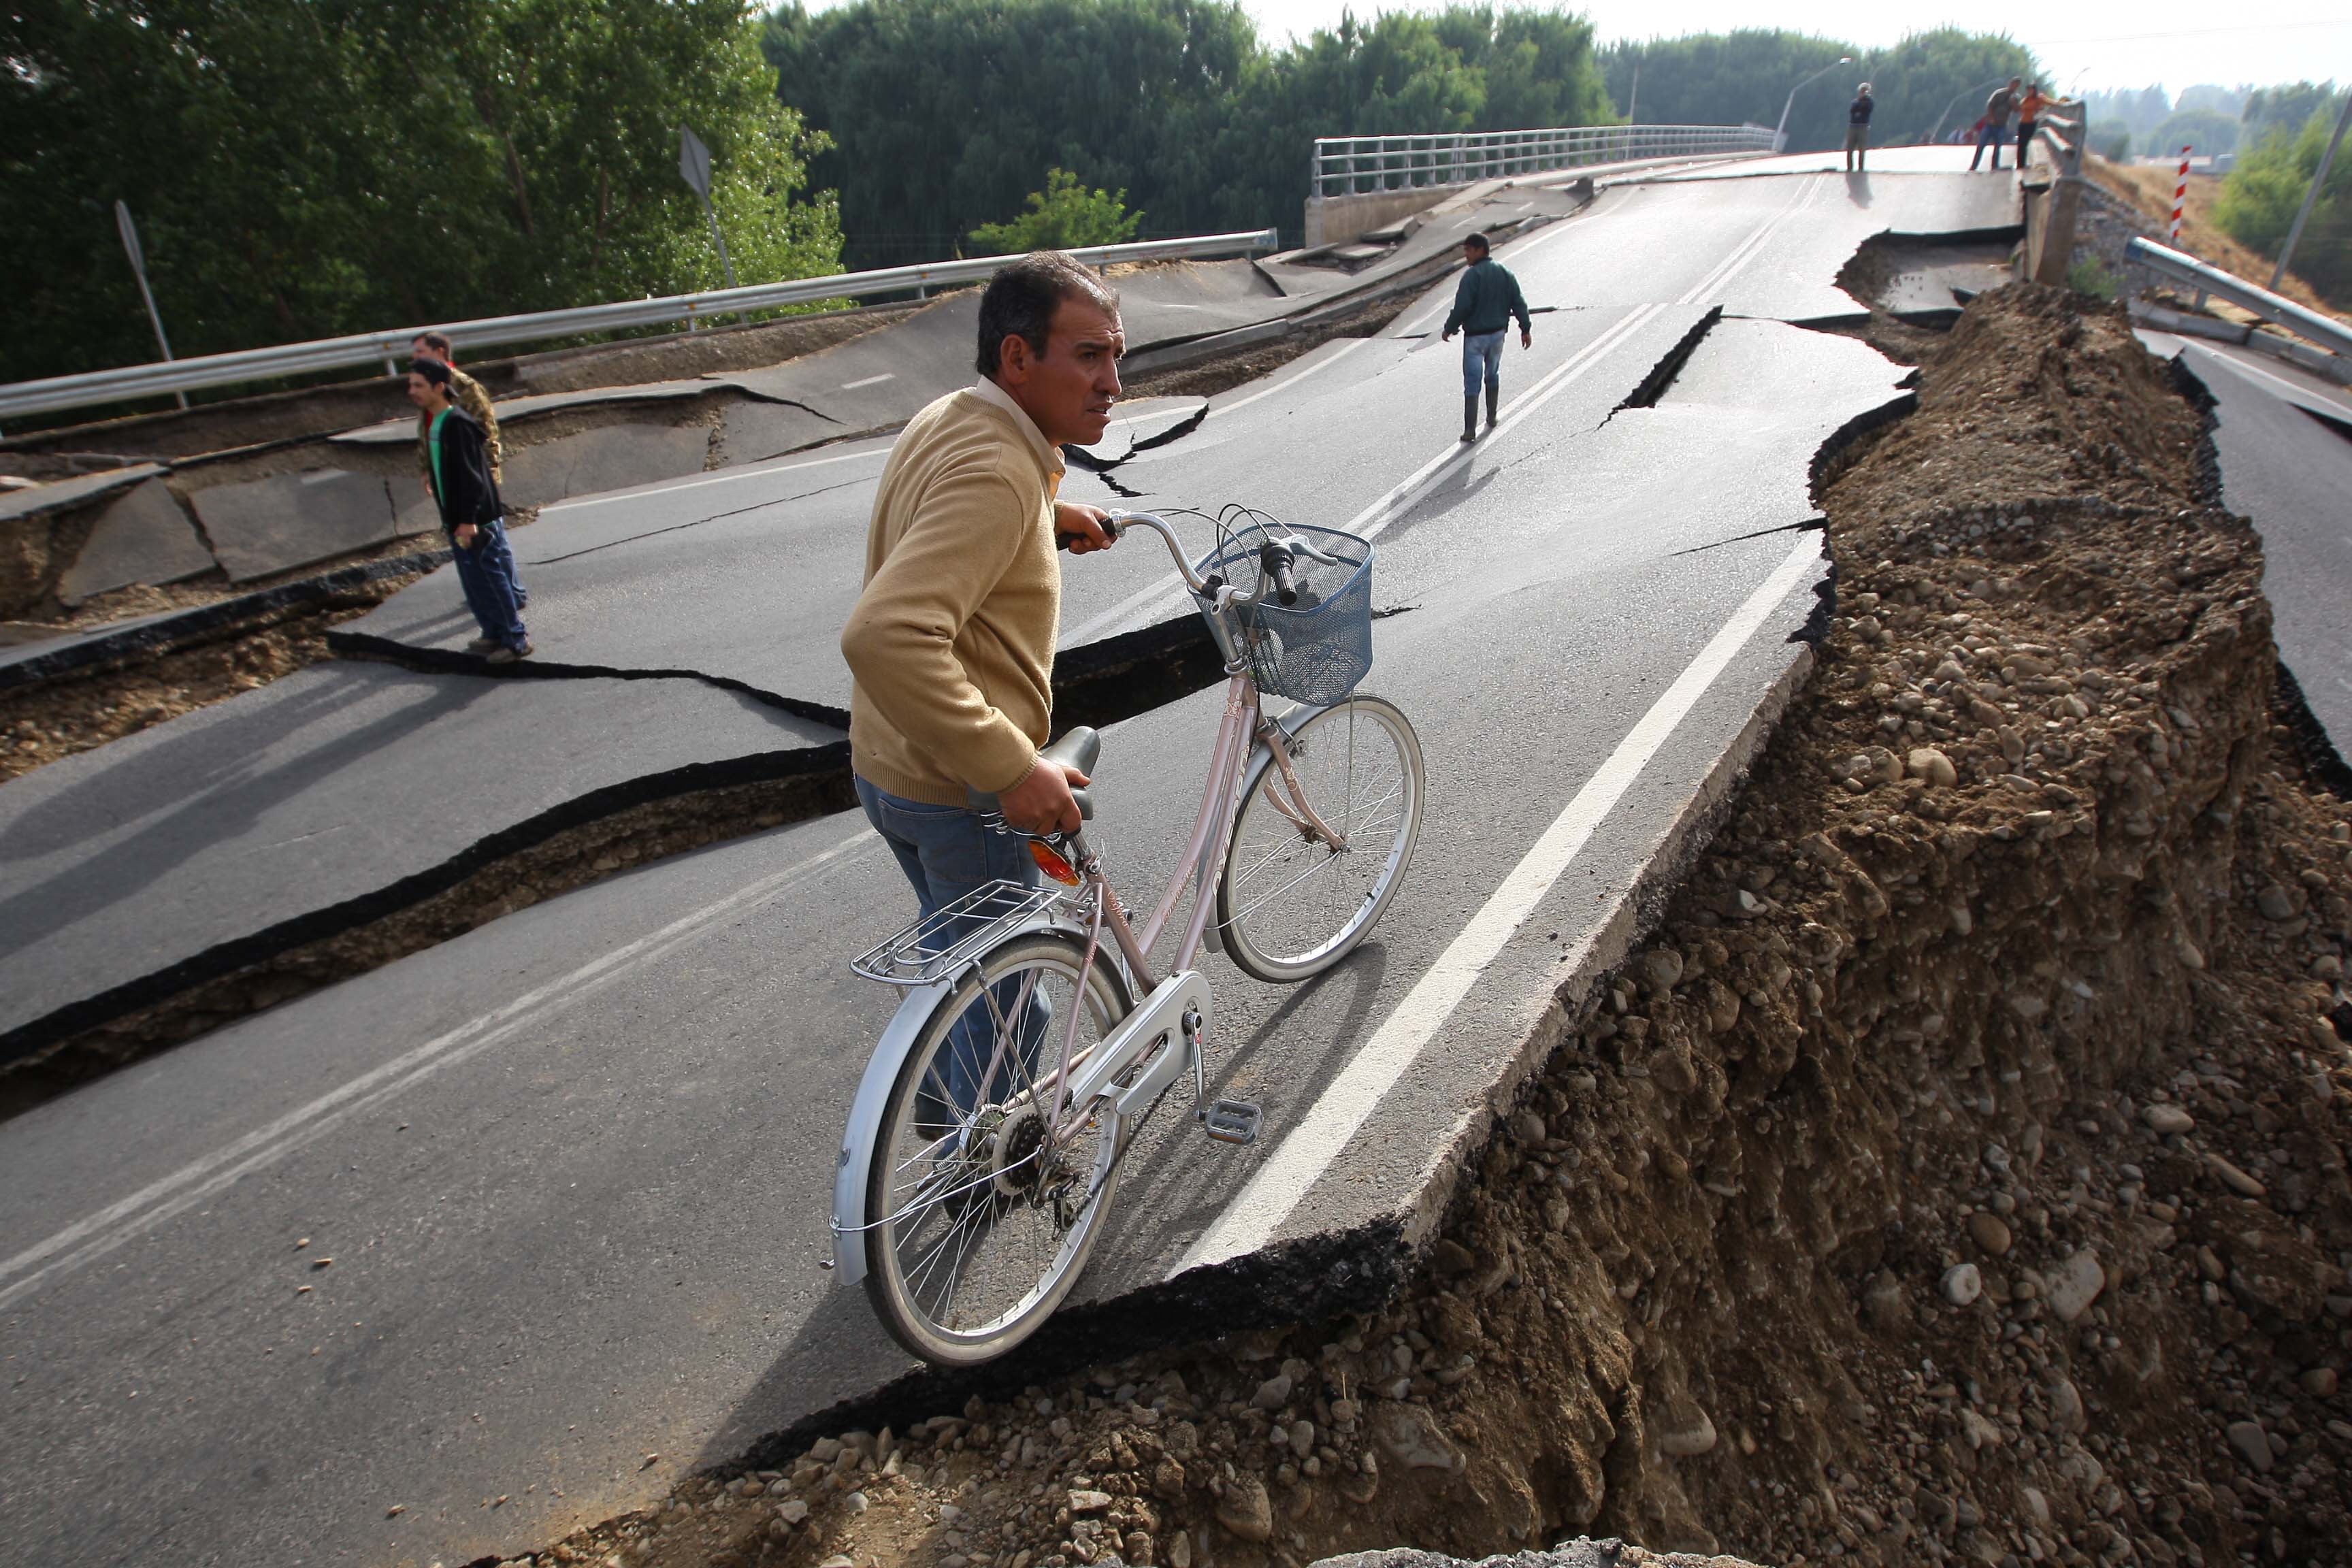
The earthquake was at least 500 times more powerful than the Haiti earthquake, and several buildings failed and infrastructure was damaged. Tsunami waves wreaked havoc along Chile’s coastline, demonstrating serious problems with Chile’s early warning system and a lack of understanding of low-elevation coastal vulnerabilities. Chile proceeded relatively quickly and efficiently, however, from response into recovery and reconstruction, primarily because it is developmentally “near First World” on most indicators and relatively well governed. Moreover, it has a history of reasonably effective building codes and apparent widespread compliance.

An Inevitable Comparison. The 2010 earthquake-tsunami was a major disaster for Chile, but unlike Haiti, it was no catastrophe. As Zack (2012: 58) explained:

The difference between Chile and Haiti in responding to and recovering from their 2010 earthquakes is a stark example of the ways in which pre-existing poverty and disadvantage increase disaster vulnerability, perhaps exponentially, given the differences in magnitude by a factor of 500, of the two earthquakes. Chile had a well-developed economy with modern infra-structure when its quake hit, whereas there were not even building codes in Haiti. That is, Haiti was physically more vulnerable to the violence of disaster than Chile. Chile’s president made a post-quake address within two hours, while it took Haiti’s president 168 hours. That is, the Haitian government was either less willing to respond to a disaster, or less able.

While there are many lessons to be learned from a Haiti-Chile comparison, one takeaway stands out for our equation: Exposure differentials due to population size, density, and development levels matter significantly, but the key is differential vulnerabilities (plural) and one vulnerability in particular – building standards and compliance.

Cited References: Dubois, Laurent, Haiti, The Aftershocks of History (New York, NY: Metropolitan Books, 2012). Zack, Naomi, “Violence, Poverty, and Disaster: New Orleans, Haiti, and Chile,” Radical Philosophy Review Vol. 15, No. 1 (2012): 53-65.


- Richard S. Olson, Ph.D.