Country: Indonesia
Country: Japan
Principal Area of Impact
Aceh Province, Indonesia / Northern end of Sumatra Island
Previous Year's Gross Domestic Product (GDP)
234.8 Billion USD (2003)
Previous Year's Gross Domestic Product Per Capita
1,076 USD (2003)
Source(s)
• 2000 Population Census, BPS-Statistics Indonesia
• World Bank Group
Principal Area of Impact
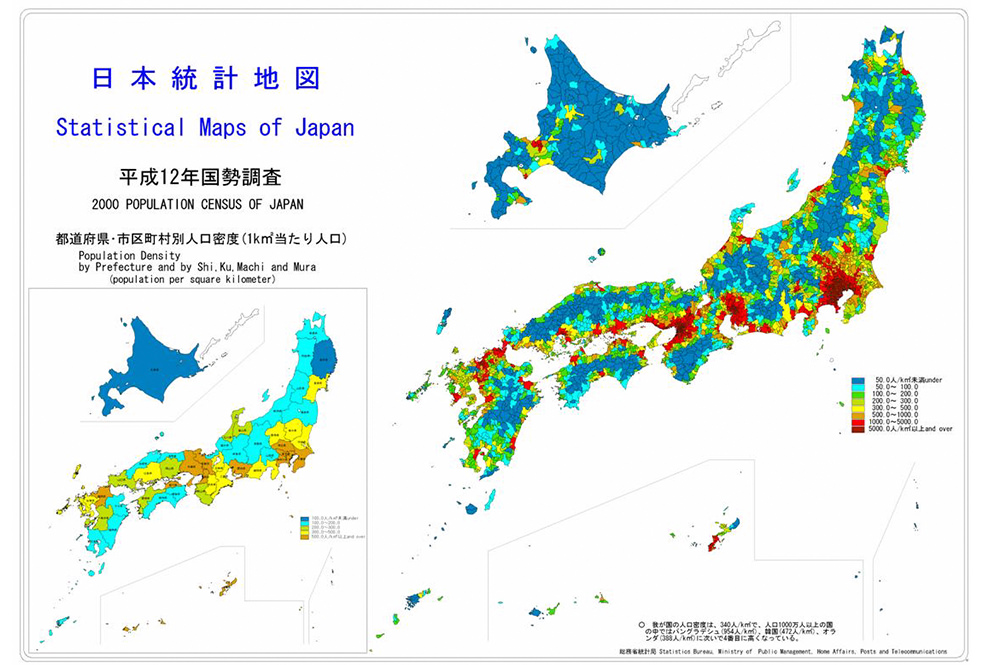
Tohoku Region, Japan / Northeast Honshu Island
Previous Year's Gross Domestic Product (GDP)
5.495 Trillion USD (2010)
Previous Year's Gross Domestic Product Per Capita
43,118 USD (2010)
Source(s)
• Population and Households of Japan 2010, Statistics Bureau of Japan
• World Bank Group
Governance
World Bank Group Indicator –
Regulatory Quality (Percentile Rank):
20.6 (2003)
World Bank Group Indicator -Government Effectiveness (Percentile Rank):
37.6 (2003)
World Bank Group Indicator –
Rule of Law (Percentile Rank):
20.6 (2003)
World Bank Group Indicator – Voice and Accountability (Percentile Rank):
37.0 (2003)
World Bank Group Indicator – Political Stability and Absence of Violence (Percentile Rank):
2.9 (2003)
Corruption
World Bank Group Indicator – Control of Corruption (Percentile Rank):
14.6 (2003)
Transparency International Corruption Perception Index Score:
1.9 (2003)
Transparency International Corruption Perception Index Rank:
122 out of 133 (2003)
Development
World Bank Group - GINI Index:
Not Available
Previous Year’s Human Development Index Score (HDI):
0.697 (2003)
Previous Year’s Human Development Index Rank (HDI):
110 out of 177
Source(s)
• World Bank Group
• Human Development Report 2005
Governance
World Bank Group Indicator –
Regulatory Quality (Percentile Rank):
81.8 (2010)
World Bank Group Indicator -Government Effectiveness (Percentile Rank):
90.4 (2010)
World Bank Group Indicator –
Rule of Law (Percentile Rank):
88.2 (2010)
World Bank Group Indicator – Voice and Accountability (Percentile Rank):
80.1 (2010)
World Bank Group Indicator – Political Stability and Absence of Violence (Percentile Rank):
76.9 (2010)
Corruption
World Bank Group Indicator – Control of Corruption (Percentile Rank):
91.9 (2010)
Transparency International Corruption Perception Index Score:
7.8 (2010)
Transparency International Corruption Perception Index Rank:
17 out of 178 (2010)
Development
World Bank Group - GINI Index:
Not Available
Previous Year’s Human Development Index Score (HDI):
0.884 (2010)
Previous Year’s Human Development Index Rank (HDI):
11 out of 169
Source(s)
• World Bank Group
• Human Development Report 2010
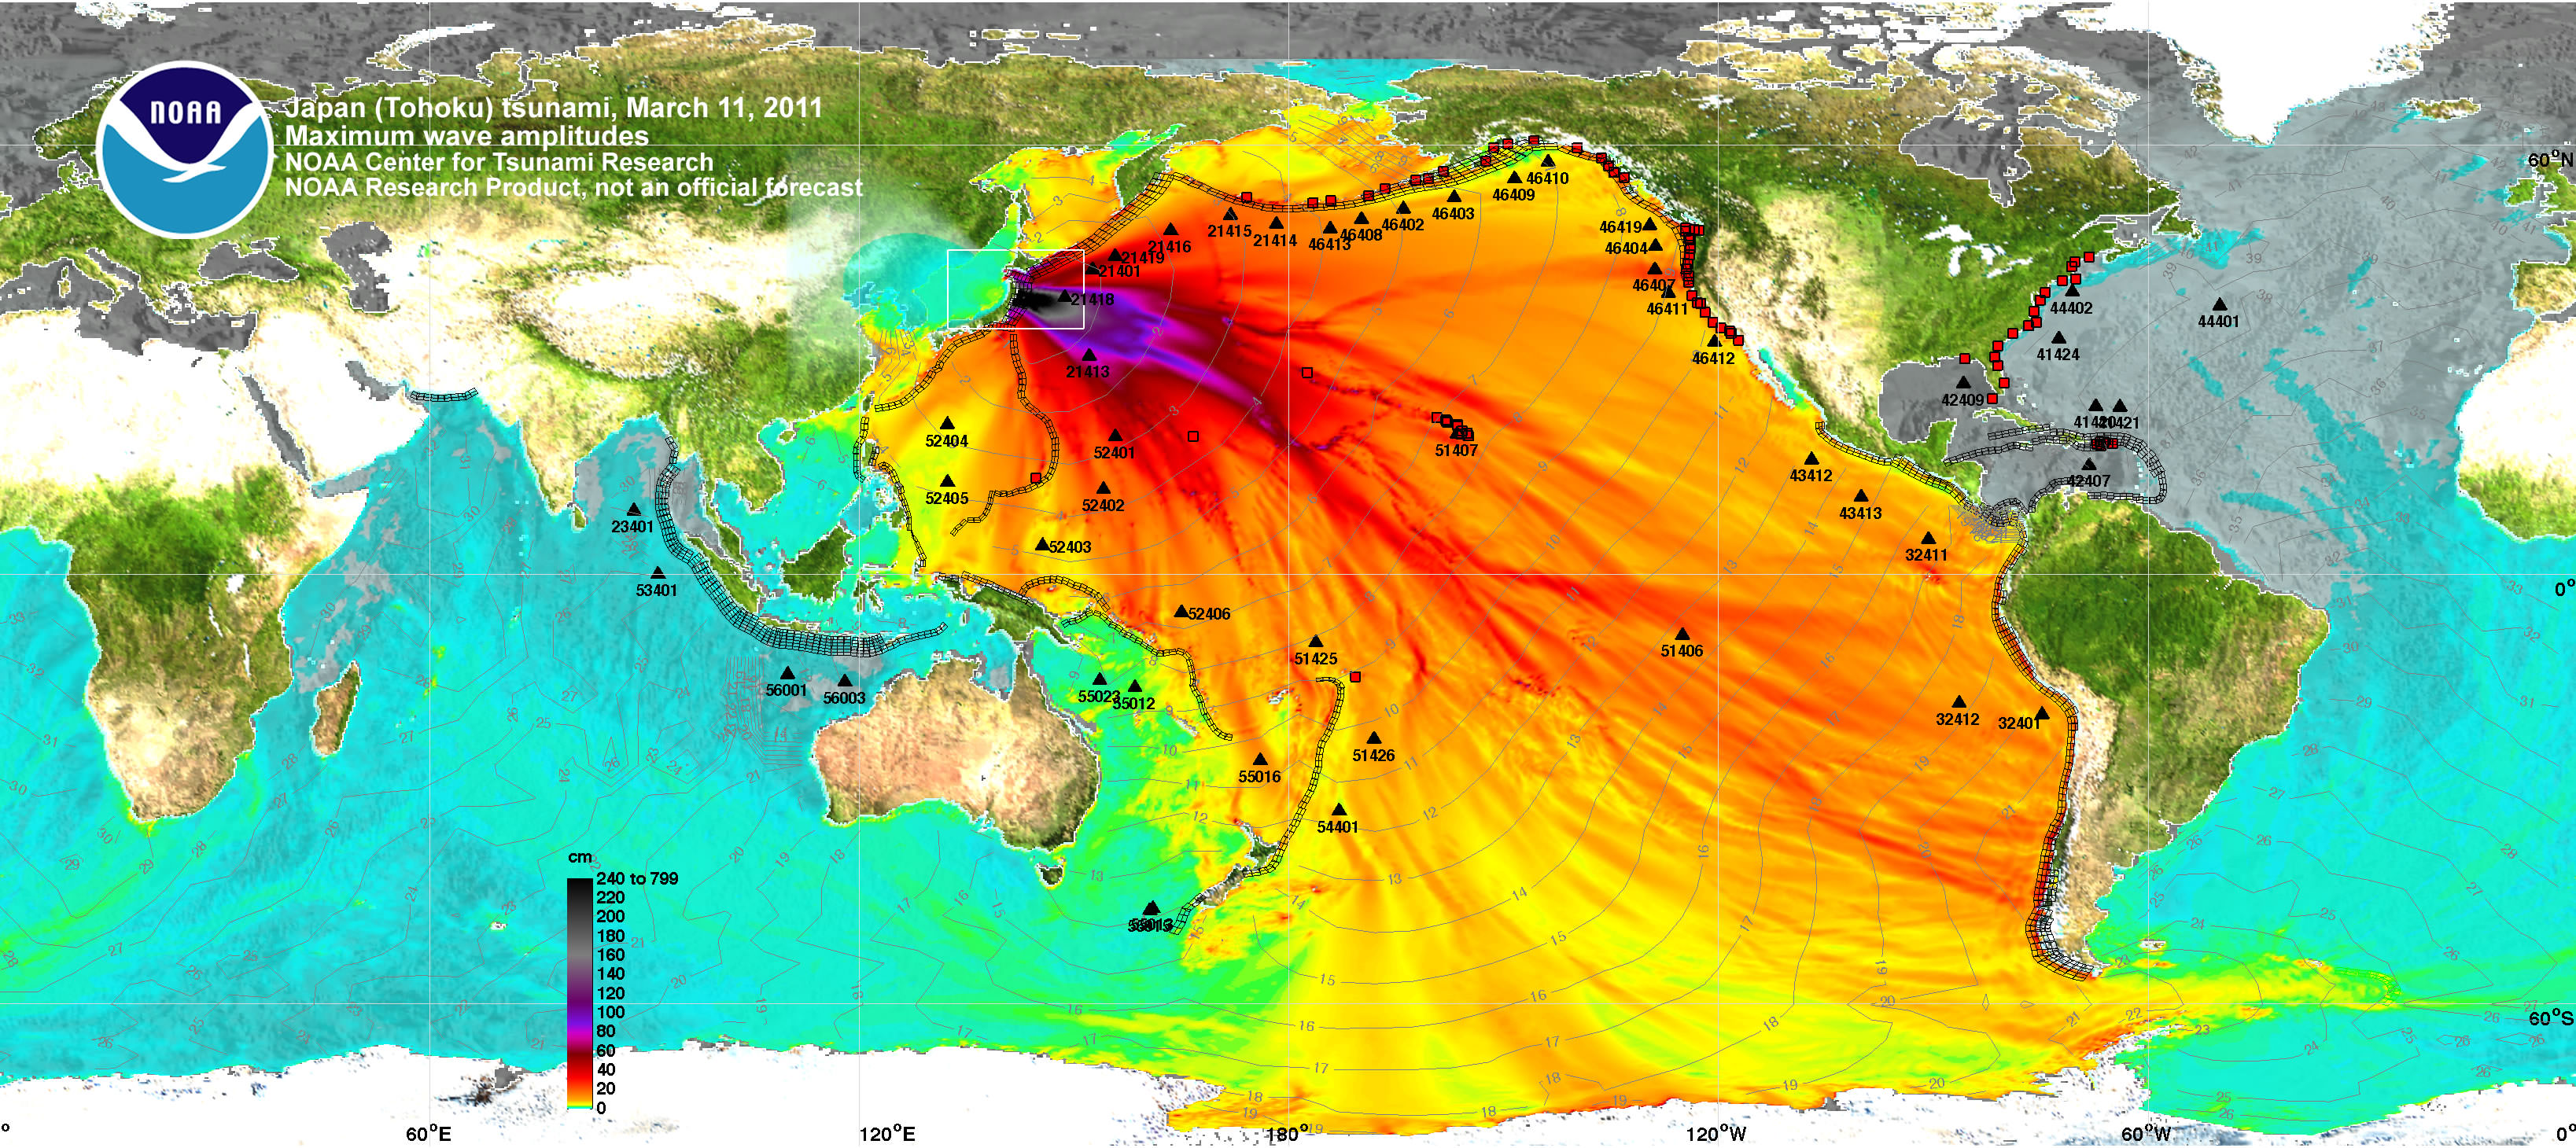
While both tsunamis were triggered by offshore earthquakes, their impacts were very different, particularly in geographic scale. While the 2004 event had damaging effects of various levels on human and economic exposures in low-elevation coastal zones in fully 14 countries around the Indian Ocean, the 2011 event will forever be remembered for its coastal impacts in one country (Japan), but particularly for its overwhelming effects on one specific exposure: the Fukushima Daiichi Nuclear Power Station, where reactor cooling systems proved highly vulnerable. Indeed, for Japan it was a “cascade” (earthquake-tsunami-radiologic) hazard event and a catastrophe for the three most affected prefectures.
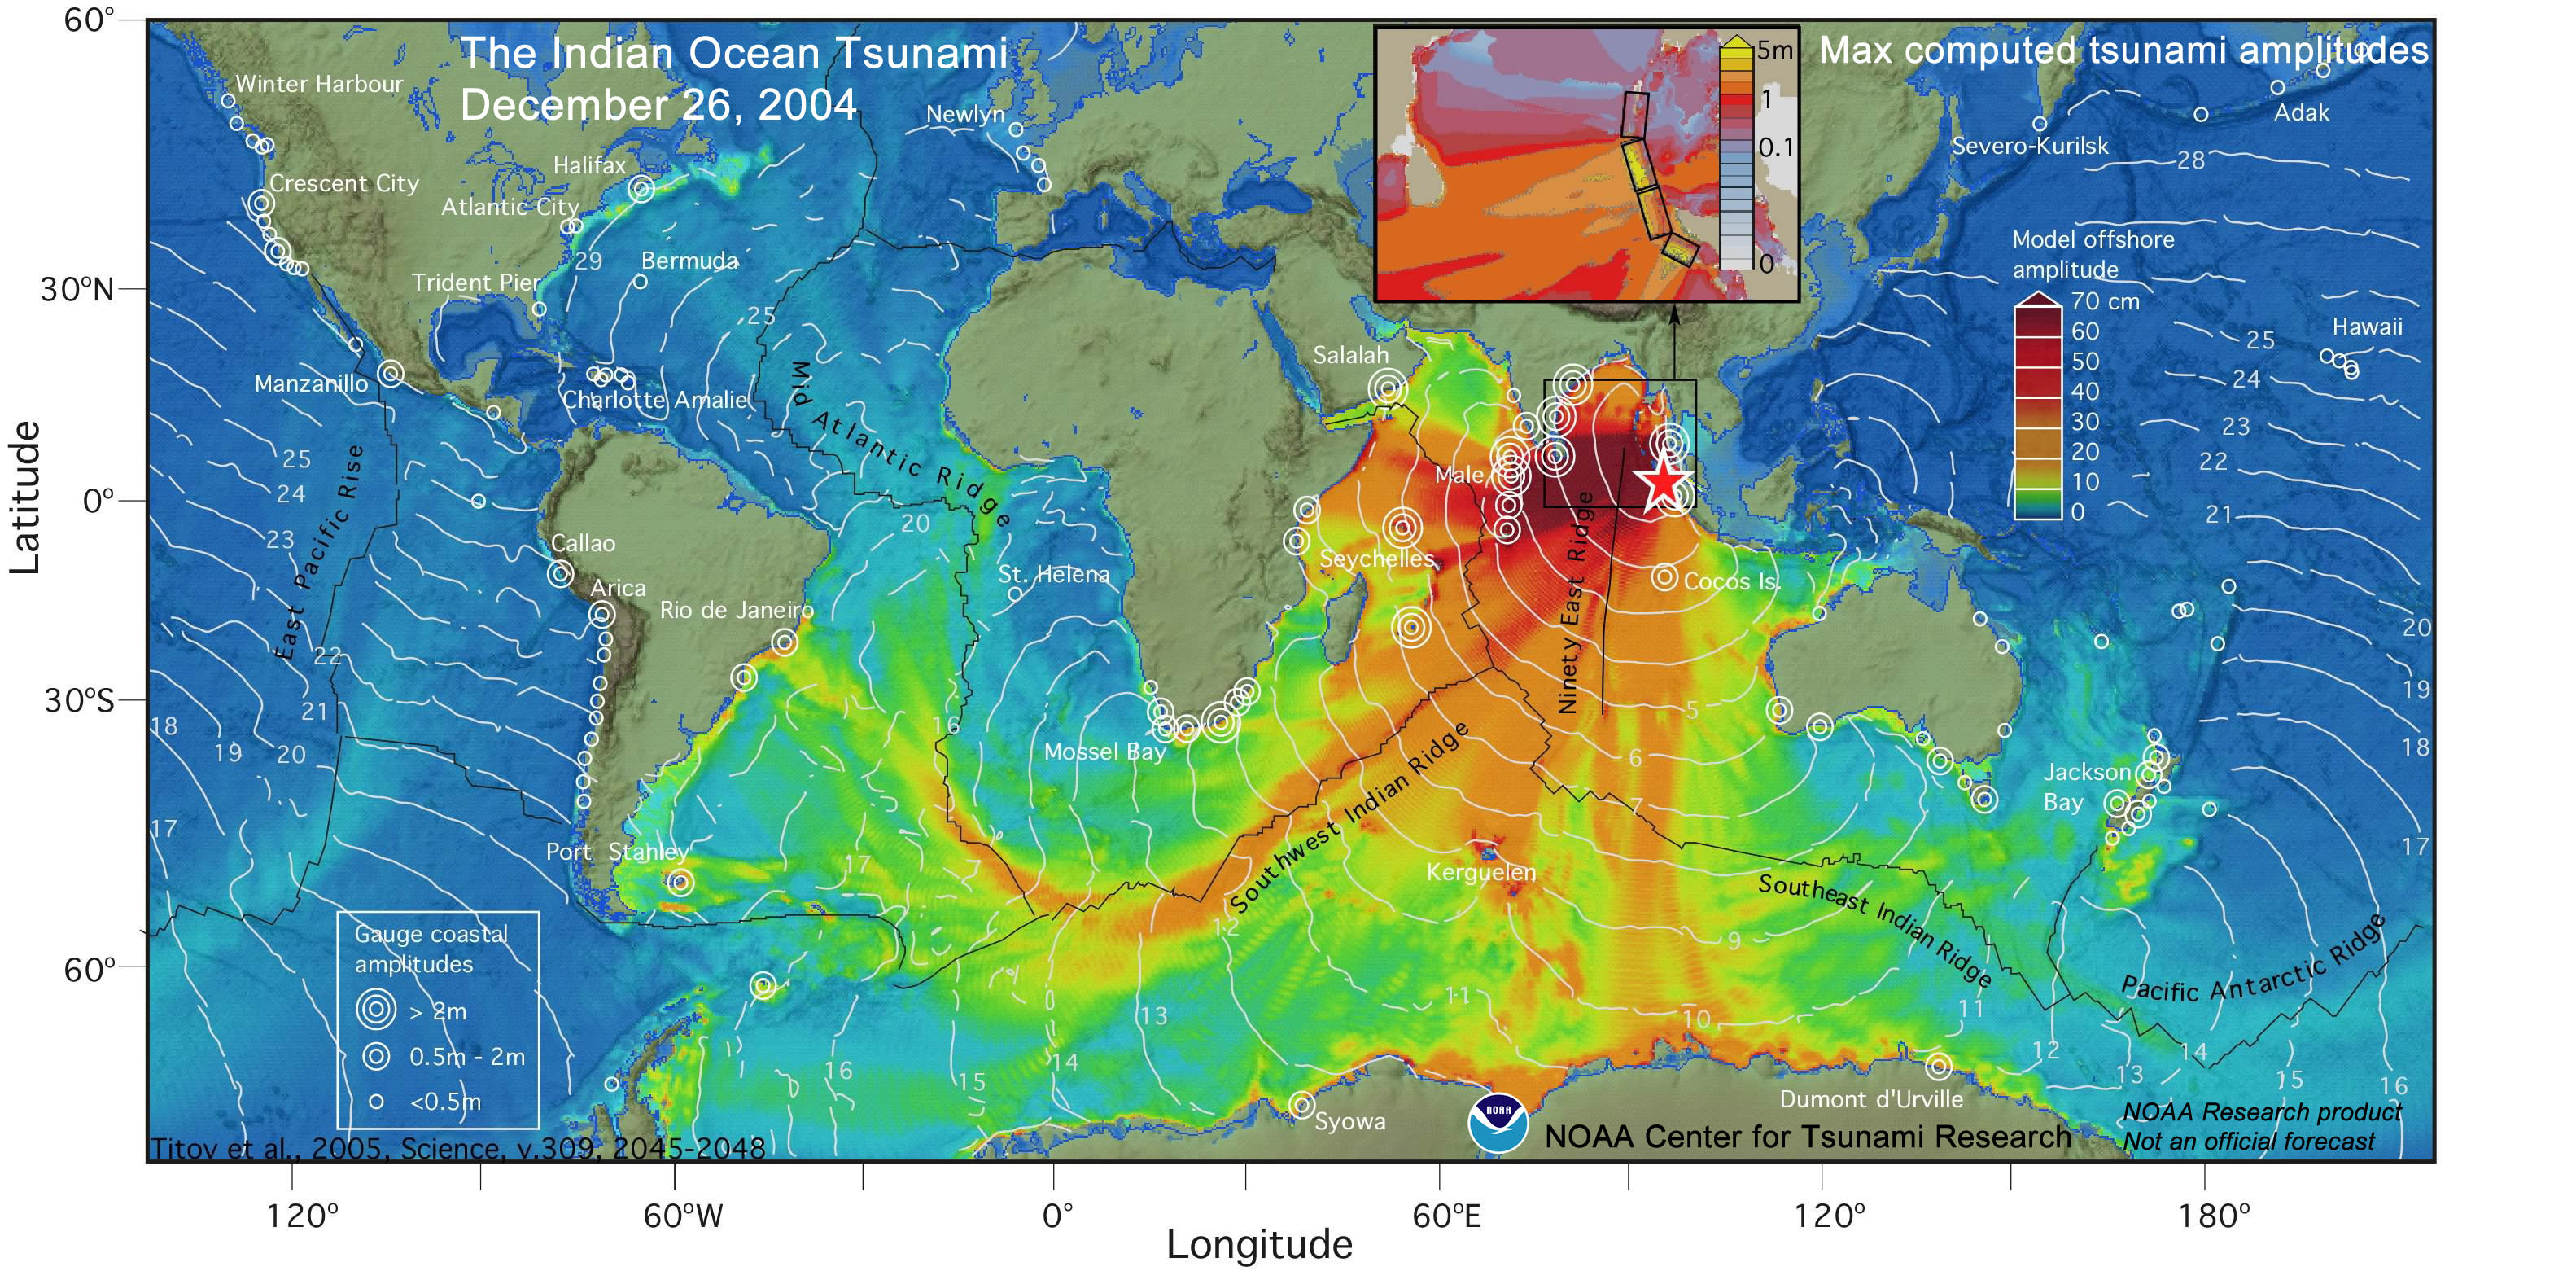
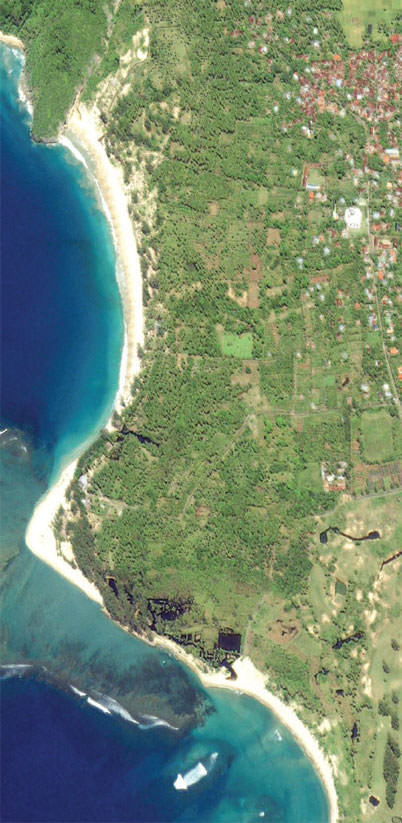
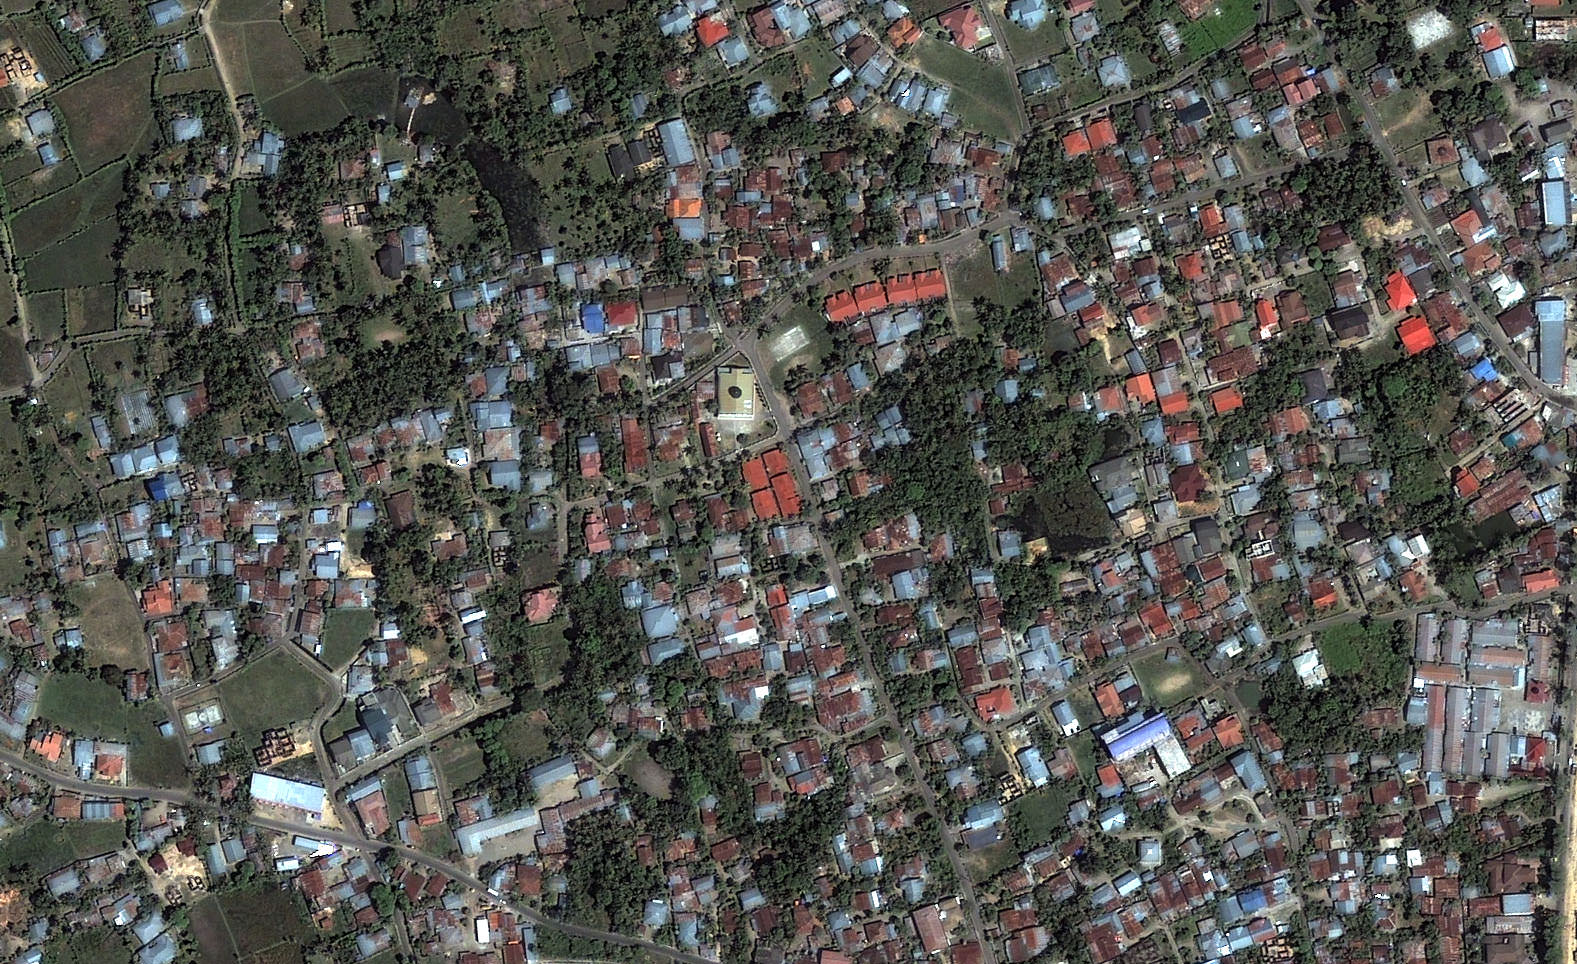
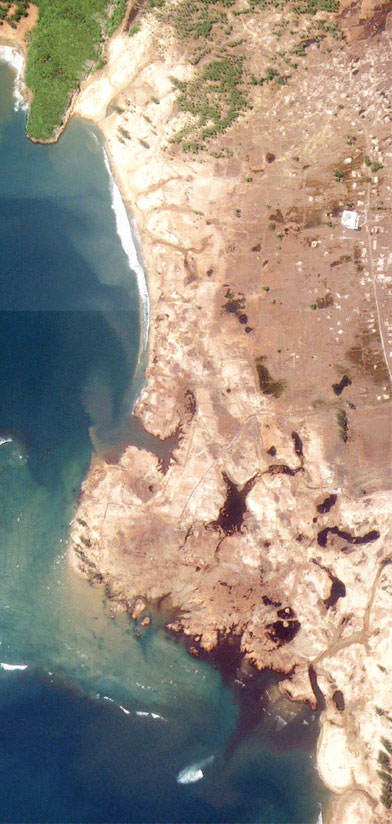
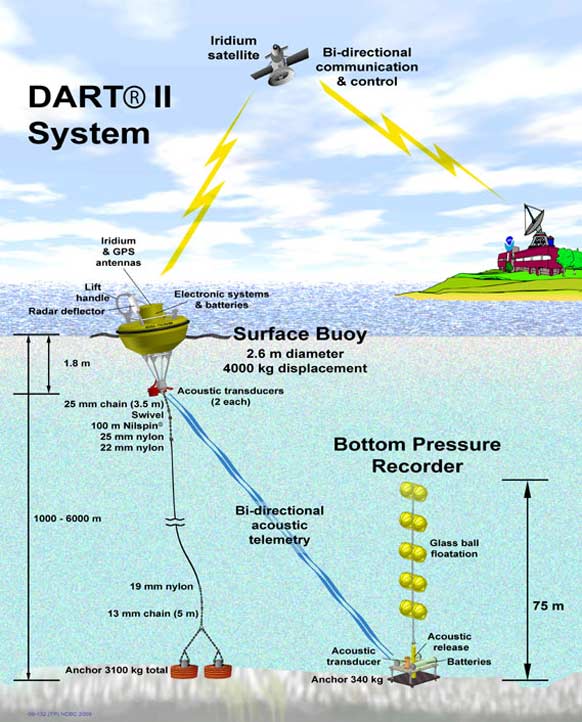
The Asian Tsunami. On December 26, 2004 a 9.1-9.3 magnitude earthquake off the west coast of Sumatra, Indonesia ruptured a fault longer than the state of California. The undersea megathrust hazard event triggered tsunami waves, some reaching 30 meters high in places along the coasts. Given urban and other coastal development in recent decades in many of the countries, including right on the water’s edge, exposures had greatly increased, and all told the waves killed at least 230,000 people (EM-DAT) and caused more than $10 billion in damage (precise numbers will never be possible). While tsunami hazard early warning systems had been deployed in other oceans, the Indian Ocean lacked Deep-ocean Assessment and Reporting of Tsunami (DART) buoys, so modern technology-based tsunami warning systems were also lacking. Within minutes of the earthquake, waves hit coastal areas of Indonesia’s Aceh Province, leveling villages one after another. One-third of the province’s capital Banda Aceh – population more than 250,000 – was washed away, and mud covered everything three kilometers inland in places along the coast. The human losses could have been worse, however, because traditional local knowledge still reigned in some communities:
The closest land to the earthquake’s epicenter was the Indonesian island of Simeulue, only thirty miles to the south…. Eight minutes after the shaking stopped, a thirty-foot tsunami wave struck the village of Langi…. This wall of water bulldozed everything in its path…, leaving nothing to show that families had once lived there except concrete foundations of houses…. But in spite of this total destruction, not a single person among the 8,000 villagers died. For as soon as the shaking began, everyone ran as fast as they could for the high ground of the mountains (Parker 2010: 164).
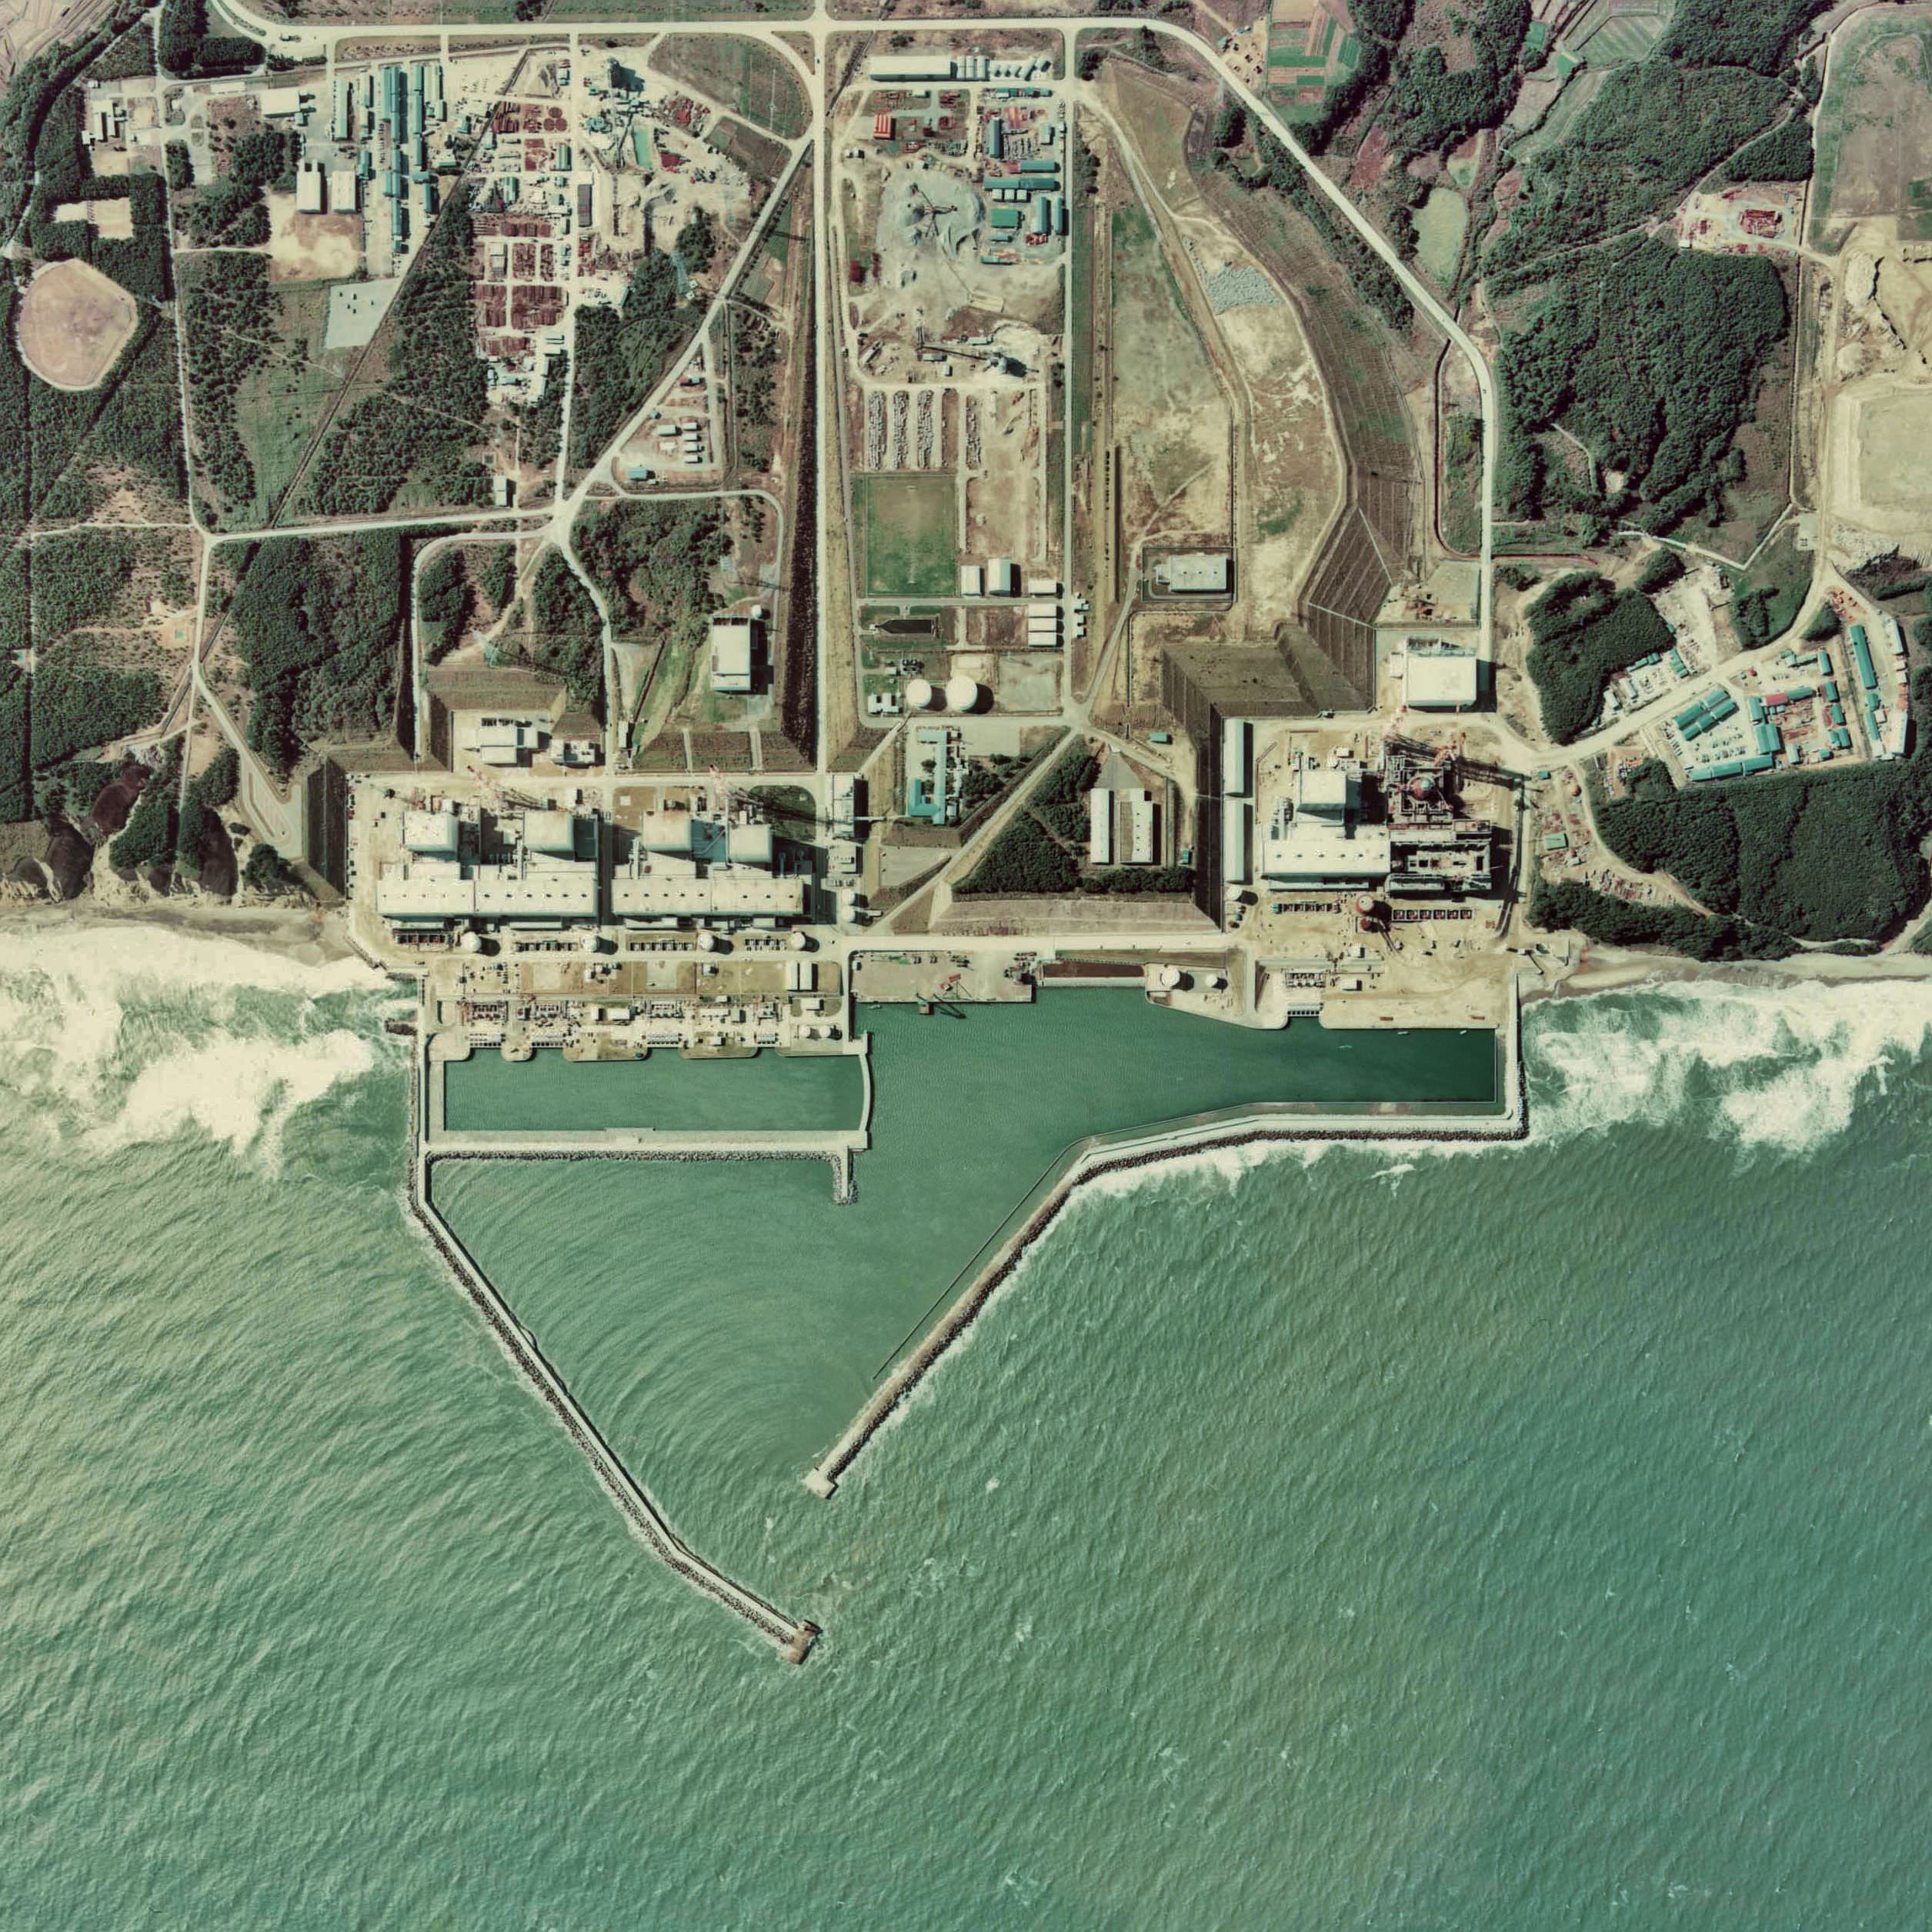
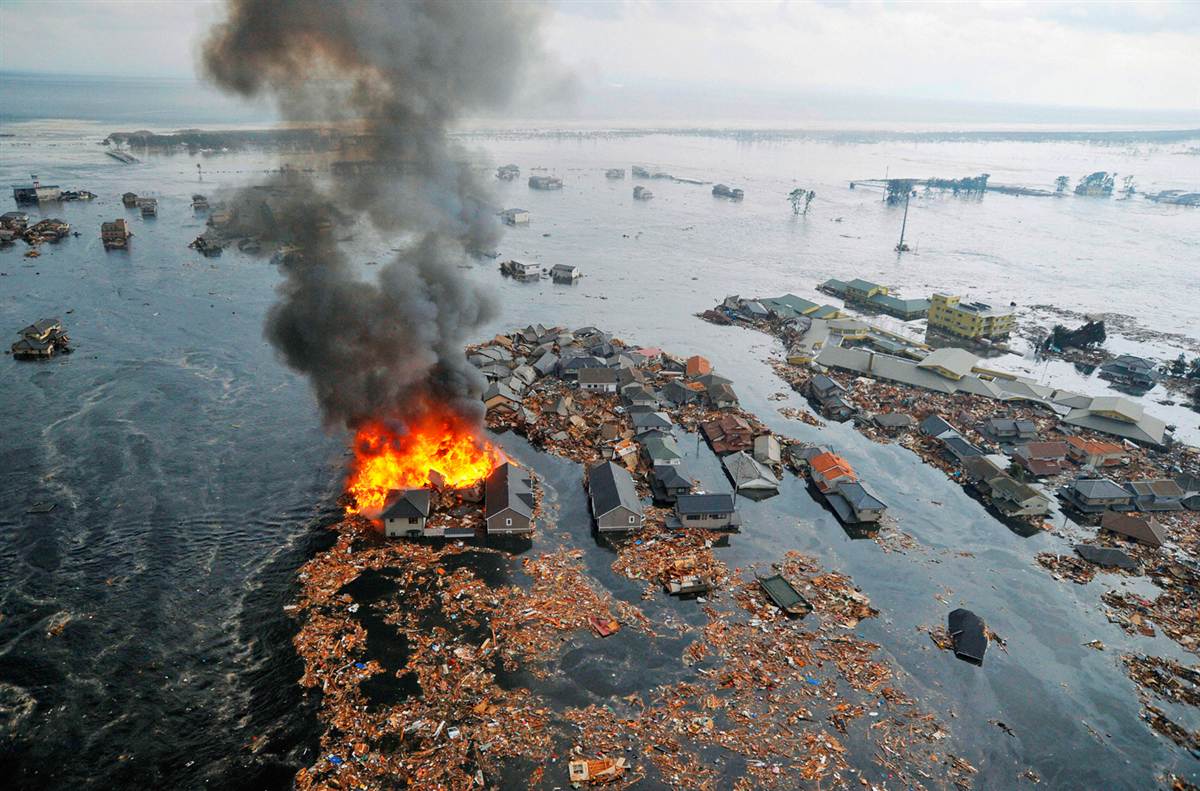
Northeast Japan. On March 11, 2011 another undersea 9.0 mega-earthquake occurred 130 kilometers from Sendai, Japan. While the earthquake rocked Sendai and was felt in Tokyo and several other major cities, the tsunami waves, some as high as 40 meters on reaching the coast, were the real killers. In the end, 19,846 lives were lost (EM-DAT), with economic loss estimates ranging from $235 billion (World Bank) to $309 billion (Japanese government). Again with only minutes of warning, entire coastal towns and villages were washed away, but one exceptional exposure right on the water, the Fukushima Daiichi Nuclear Power Station, became the focus of intense, global attention. As Mizokami and Kumagai (2015: 21) explained:
Flooding by the tsunami induced loss of AC and/or DC power for reactor cooling, hence the reactor water level decreased and fuel was exposed. Water reacting with high temperature fuel metal covering resulted in hydrogen generation and hydrogen explosion of reactor buildings… [causing] radioactive release to the environment.
Initially argued as a “beyond design-basis” tsunami event that overwhelmed the walls that were supposed to protect the installation (vulnerability reduction), “[t]he present state of knowledge suggests that [the tsunami] was not … ‘unforeseeable’…. In fact, the tsunami risk was known, but the issue was left open for many years without any concrete action by decision makers” (Nöggerath et al., 2011: 45).
As these two cases illustrate, coastal economic, infrastructure, and human exposures have skyrocketed in recent decades – but without careful attention to their tsunami vulnerabilities – which is the takeaway for our equation. These vulnerable exposure increases have occurred in both highly developed (e.g., Japan) as well developing (e.g., Indonesia) countries. Given the speed at which tsunami waves propagate, often 500 mph in the open ocean before slowing down and “piling up” near coasts, both technology-based and traditional/local knowledge-based alert-warning-evacuation systems are crucial for reducing potential human losses, particularly in areas with only minutes before impact. Economic and infrastructure losses from these coastal asset exposures can only be reduced by hazard-aware relocation, retrofit, and “worst-case” scenario planning.
Cited References: Mizokami, Shinya and Yuji Kumagai, “Event Sequence of the Fukushima Daiichi Accident,” in Joonhong Ahn, Cathryn Carson, Mikael Jensen, Kohta Juraku, Shinya Nagasaki, and Satoru Tanaka, Editors, Reflections on the Fukushima Daiichi Nuclear Accident, Toward Social-Scientific Literacy and Engineering Resilience (Springer, 2015): 21-50.
.